Last Updated on Monday, January 10, 2005 at 20:50:50. by Gerrit Van Nieuwenhuizen and Rachid Nouicer
The purpose of PhSIS is to provide the shift crew with a set of checks to ensure that the Silicon system is functioning properly. There are two basic parts to check; functioning of the hardware and data integrity. There is not always a clear distinction between these two parts because some tests are performed by the the same program, i.e. the Online system.
This are the components of PhSIS:
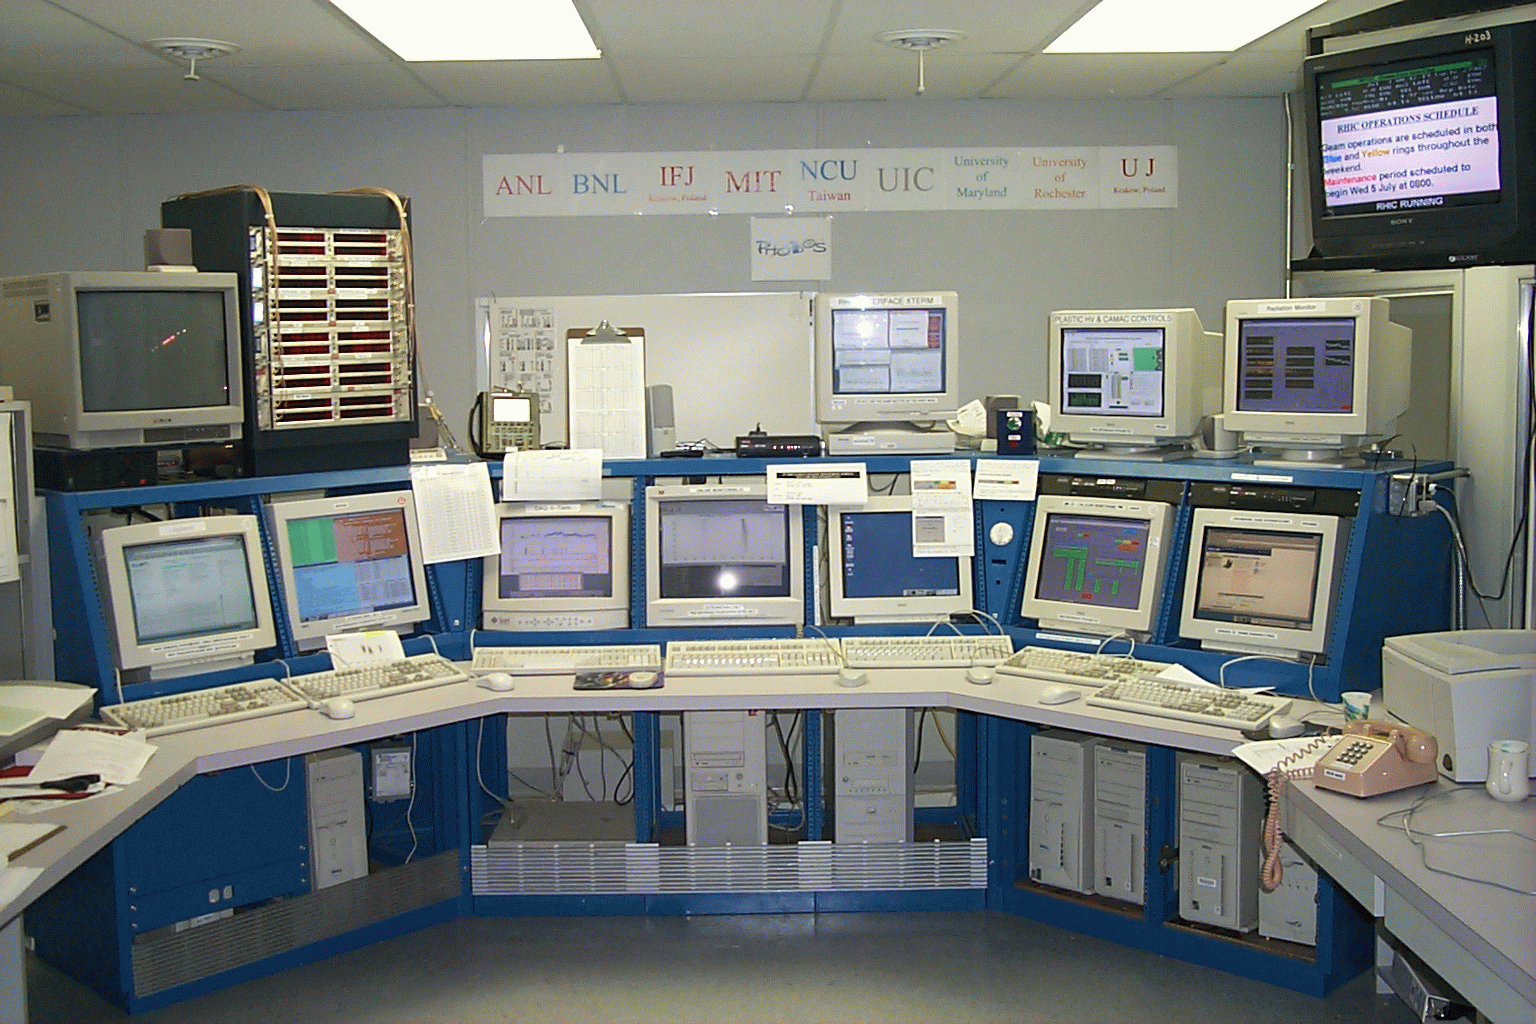
All components of PhSIS can be found in the PHOBOS Console:
Whenever the Silicon Low Voltage is switched on, the DAQ should be running. The reason is that the DAQ puts the Front End Controllers information into the database and provides Online with events to analyze.
Goto the DAQ Xterm and check the following:
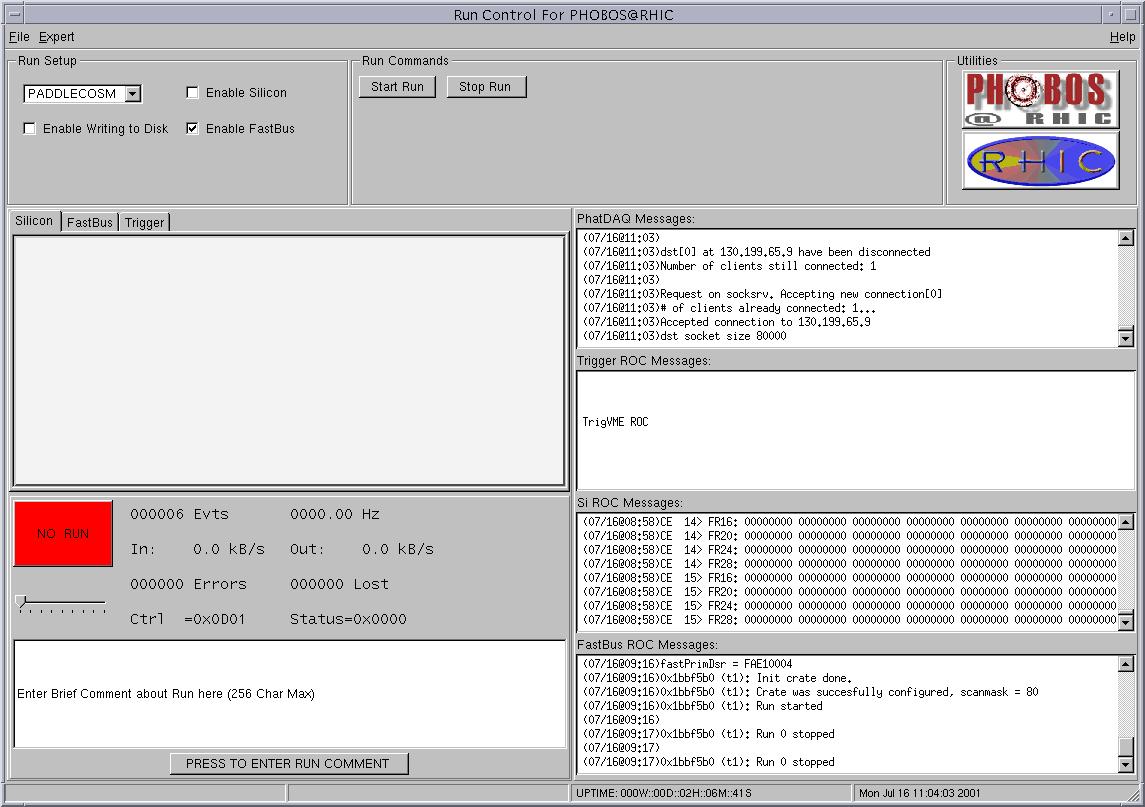
Make sure that the DAQ is running properly, by checking the DAQ Gui
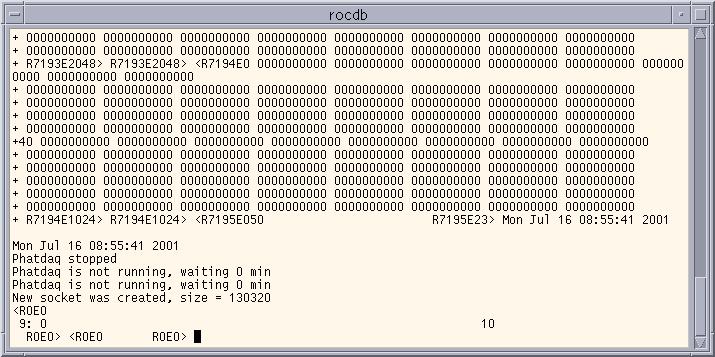
Find the ROCDB window and make sure that ROCDB is running
If there is a problem then check the DAQ documentation in the Portal and fix the problem.
Whenever the Silicon Low Voltage is switched on, the Online should be running. If the DAQ is running then the text window from which the online was started should show scrolling messages showing that the online is processing data. If this is not the case then click on the little collision button in the online GUI.
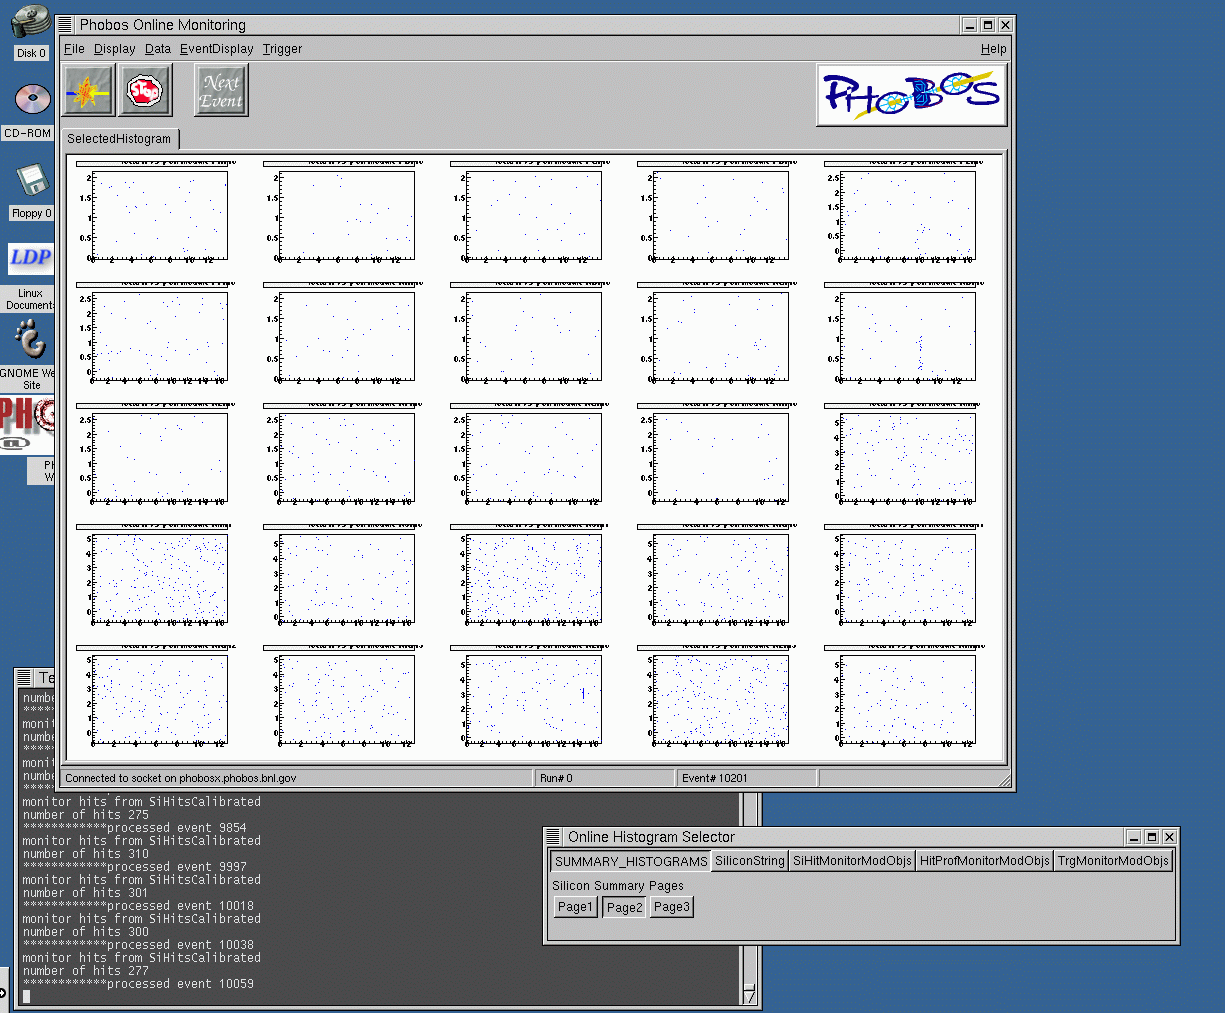
The Online takes part of the events that the DAQ is collecting and checks for Latchup and makes histograms which can be compared to reference histograms. The Online runs on the Online1 computer. If the Online detects a Latchup then a BIG RED WINDOW will appear on the screen. If this happens you have to call a Silicon Expert.
Whenever the online is running there will be an Online Histogram Selector:

Click on the Summary_Histograms button and 3 buttons will appear giving access to the summary histograms. These histograms should be checked against their reference histograms.
***EXAMPLES OF HISTOGRAMS PICTURES NOT IMPLEMENTED YET***
If there is anything suspicious about these histograms, call a Silicon Expert
SiMon controls and monitors the status of all Silicon hardware inside of the tunnel. Check the Nominal Detector Status on the Portal to see if the FEC Low Voltage and Silicon Bias should be on or off. If both of them are supposed to be off then the SiMon screen will look like this:
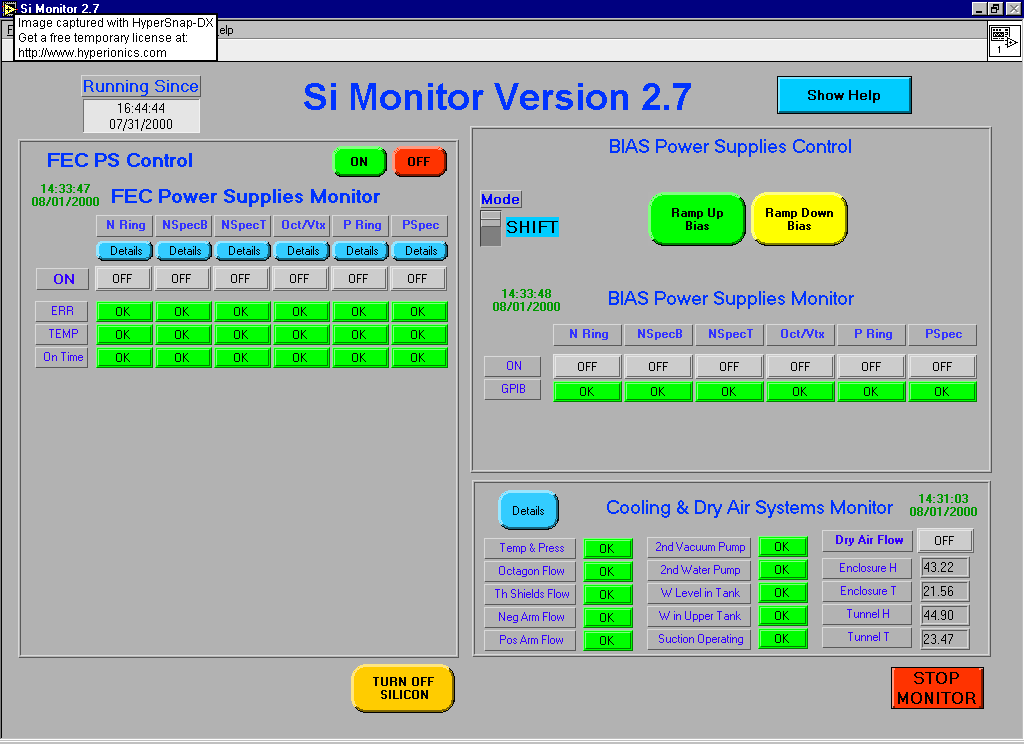
All indicators should be green in this state. If this is not the case, call a Silicon Expert.
If the FEC Low Voltage is on, but the Silicon Bias is off:
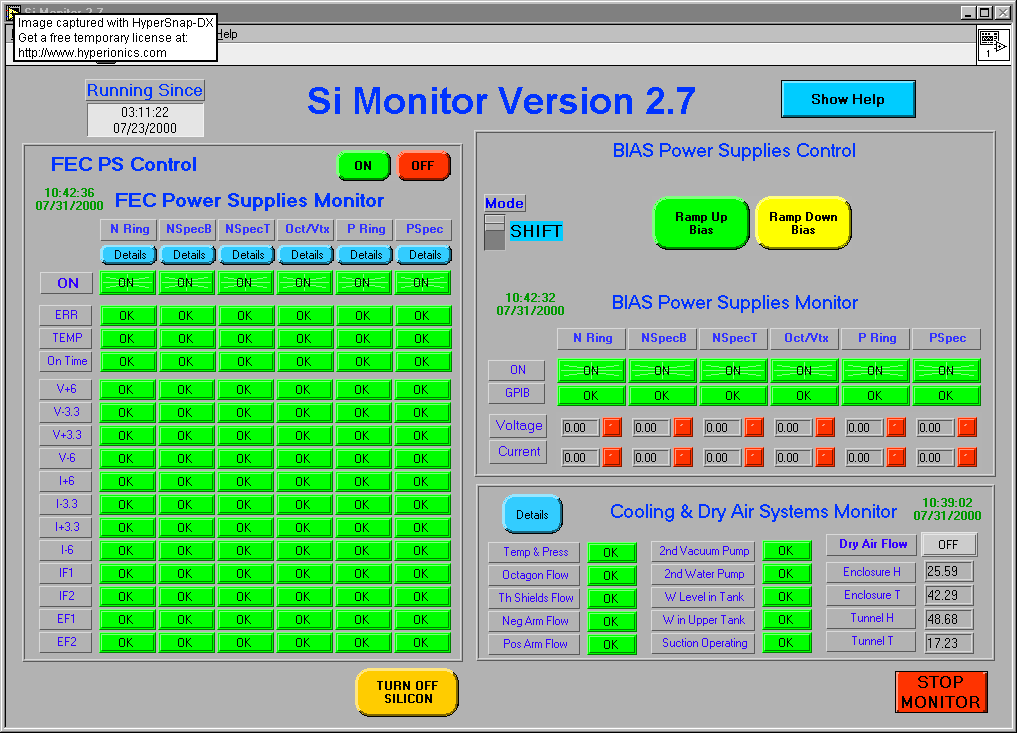
Notice that the Silicon Bias Supplies are actually on, but that the Bias has been ramped down. This is the reason that the Voltage and Current readings have red indicators. In this case there is nothing to worry about.
If the FEC Low Voltage is on and the Silicon Bias is on:
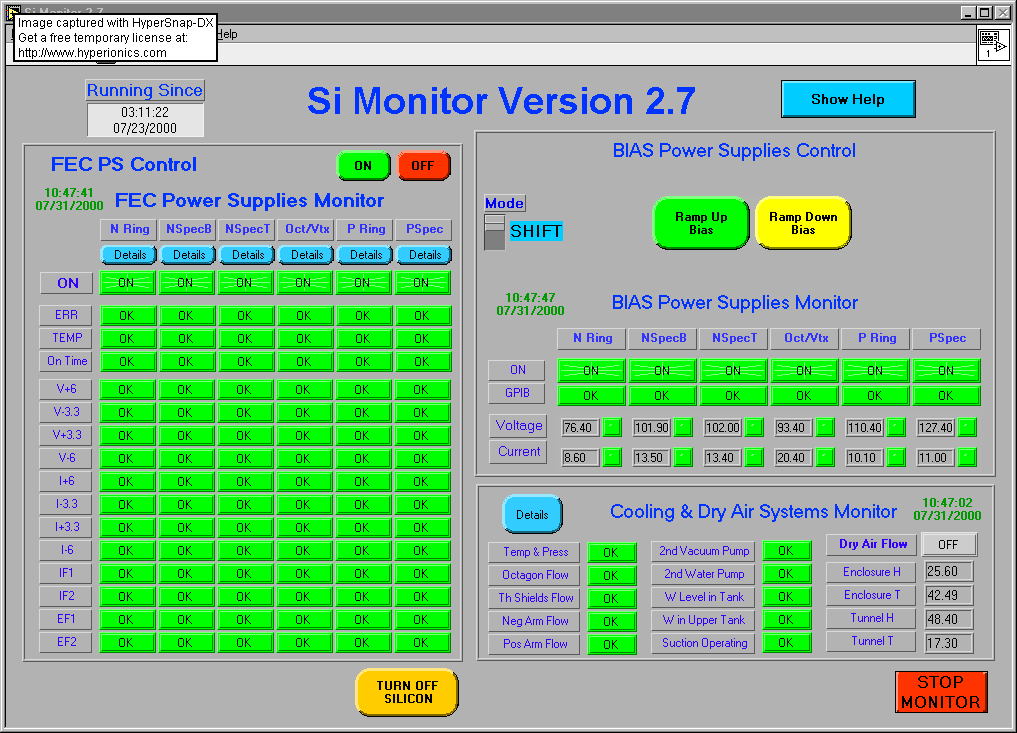
All indicators should be green in this state. If this is not the case, call a Silicon Expert.
The Portal is located on the LogBook computer:

Check if any of the items under Detector Status shows an old behind it. If this is the case for SiHybrids then check if the DAQ is running. If this is the case then check if ROCDB is running on the DAQ. If the DAQ is not running then start it. If ROCDB is not running then start it. If any of the other items under Detector Status shows an old behind it and it is on the following list:
Tunnel Temperature and Humidity
Silicon Power Supplies
then it is time to call a Silicon Expert.
Open the SiHybrids page on the Portal. It should look like this:
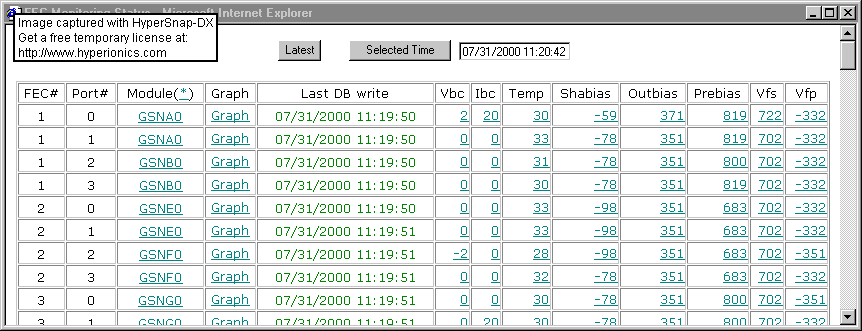
Scroll through the whole page and check the Vfp column for 0's. If you find any then call a Silicon Expert. A zero in this column means that the Latchup Protection Circuit has clamped down the FEC port. Normally this situation is also trapped by the Online.
If the Silicon Bias is on (SiMon) then also check column Ibc. If you find values greater than 400 then call a Silicon Expert.
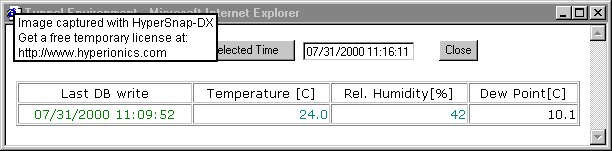
Open the THtunnel page on the Portal and make sure that the temperature is lower than 24 degC and that the humidity is lower than 50%. If this is not the case call the Run Coordinator and a Silicon Expert.
If the Silicon is on (SiMon) then open the SiPower page on the portal and compare it to the following picture:
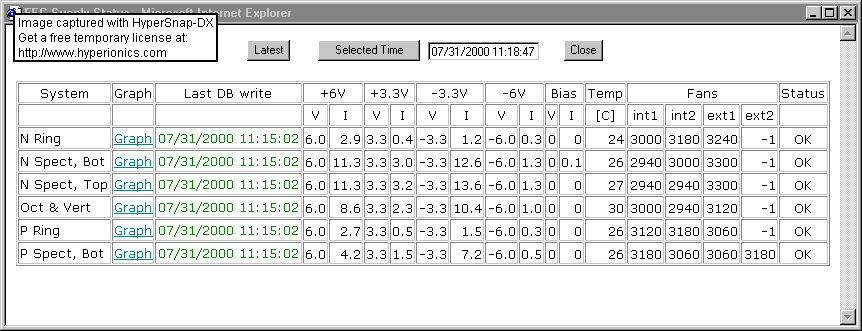
If there is a significant difference in the currents (>0.2) then call a Silicon Expert.
Open the RunLog page on the Portal.
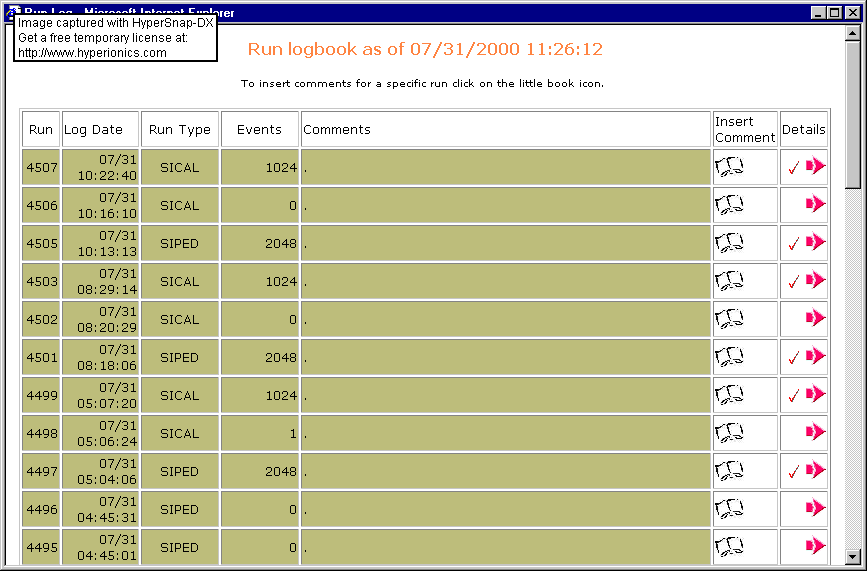
Check if Pedestal and Calibration runs have been taken regullary. In the case that RHIC has stable stores then this should have been done in between the stores. If there are no stores then this should be done every 2 hours. If this is not the case then notify the Shift Leader.
Open the Nominal Detector Status page on the Portal.
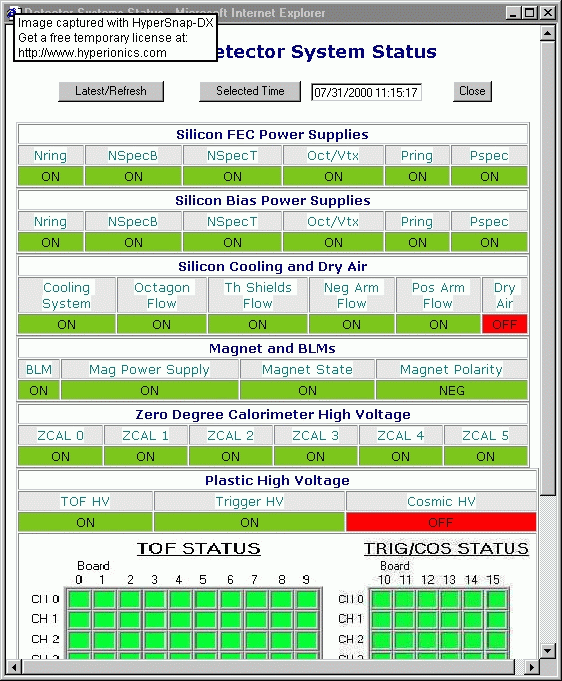
Check if the Silicon FEC Power Supplies and the Silicon Bias Power Supplies agree with what is shown on SiMon. If this is not the case then notify the Run Coordinator and a Silicon Expert.
Pedestal and calibration runs should be taken at regular intervals. If there is no beam then this should happen every 2 hours. If there are stable stores then, if possible pedestal/calibration runs should be taken in between the stores. Whenever taking pedestal files make sure that the bias has been on for, at least, 5 minutes, so that the silicon system had time to stabilize. Also make sure that there is NO injection and/or ramping during taking of these runs, as it introduces signals and noise in the data being taken.
The procedure for taking pedestal/calibration in between the stores is as follows:
the beams have been dumped and hopefully MCR warned you about it, so that the silicon bias could be ramped down
call MCR to ask them not to inject and/or ramp for 15 minutes and only proceed wit the rest of the procedure if they agree to this (if the silicon bias is still on because the beams were dumped by accident, then ramp down the silicon bias when MCR does not agree to these 15 minutes)
ramp up the silicon bias and wait for 5 minutes
take a pedestal run
take a calibration run
ramp down the silicon bias
when you are finished call MCR, thank them for waiting and tell them that PHOBOS is ready for beam again
analyze the pedestal/calibration files, see PedCalc/GainCalc
PedCalc and GainCalc are being run on the PHAST computer. These macros calculate all relevant information needed to process the Silicon data in later runs. They write the results directly into the database. Pedestal and Calibration runs which have been processed in this way show up in the RunLog with a checkmark in the last column. Look at the event size of the files, for a Pedestal/Calibration file this should be 2048/1024. Also look if there is a comment for the files which signals a problem. If the file size differs or there is a problem do not run PedCalc/GainCalc on it. If the Pedestal and Calibration files seem to be OK, but they have not been processed then notify the Shift Leader.
The macros can be found on PHAST in $PHATHOME/sigproc/macros. The two macros are called:
histpedcalc.C
new_gaincalc.C
For further information look under the Si Calibrations documentation in the Portal.
TrgSi_Analyze is being run on the PHUCSIA computer. This macro analyzes the trigger and silicon information from the datafiles. It has to be run on each sequence of the datafiles to determine if both trigger and silicon are functioning properly. After this macro has finished you have to run two other macros to plot the relevant trigger and silicon plots. Check the folders containing the trigger plots and the silicon plots if they contain the plots for the last runs. If some of them are missing then notify the Shift Leader.
The macros can be found on PHUCSIA in $PHATHOME/macros/trg. The three macros are called:
trgsi_analyze.C
trg_rhicplots_calibrate.C
si_analyze_plot.C
For further information look under the Online documentation in the Portal.
Disregard the instructions in this chapter, we're still working on the rc_reset_latchup().
Latchup means that part of the Silicon system is not working anymore because one or more chips where kicked into a funny state. The most likely cause for this are ionizing particles hitting the chips. Usually this condition is trapped by the Latchup Protection Circuitry, which then switches off the low voltage to the FEC port that the chips are connected to. This situation will be detected by the Online and a BIG RED WINDOW will appear on the Online computer. Stop the run immediately when this happens. The Si Hybrids page should show a zero for the Vfp of one of the FEC ports. If this is the case then issueing the rc_reset_latchup() command in the run_control window off the DAQ should bring everything back to normal. Check the Si Hybrids page again to see if the zero in the Vfp column has disappeared (click latest and check if you are actually are getting a new reading, the values are updated every minute). If there are any problems then call a Silicon Expert. Always make a note in the LogBook that a Latchup occured and how it was solved.
Please send all comments and suggestions regarding this page to Gerrit. |