Last Updated on
Tuesday, August 19, 2014 at
15:45:49. by Author: Corey Reed
Silicon Calibrations, General Information
Contents
Pedestals will be processed automatically on "ALLBEAM" (data
taking) runs. This is handled by the pedestal daemon, part of the datamover.
The run type "SIPED" is for testing by the experts. Pedestals will not be
calculated automatically on "SIPED" runs. See Pedestals for
the Expert for info on analyzing these runs.
Gain calibration requires a dedicated run, type "SICAL." See the DAQ instructions. When RHIC is operational, gain runs can
be taken between stores. There should be no beam during these runs, and silicon should be
at full bias.
Do nothing. Pedestals will be automatically calculated, verified and written to the
database. If there are problems and this does not happen, an alarm will sound. The alarm
will tell you to call an expert if appropriate.
Do nothing. Gains will be automatically calculated, verified and written to the
database as soon as the "SICAL" run is completed. If there are problems and this
does not happen, an alarm will sound. The alarm will tell you to call an expert if
appropriate.
This should not need to be done by the shift crew. The following macros are to be used
by experts to examine the pedestal and gain calibrations. These should only be used
if (a) the run type is "SIPED" or (b) the ped_daemon did not start pedestal
calculation automatically.
To process pedestals by hand, do the following.
- Log into phast.phobos.bnl.gov as shift.
- cd to SHIFT_MACROS.
- Start phat.
- Pedestals are processed by hand with the si_ped_gain_calc.C macro:
.x
si_ped_gain_calc.C(run,seq);
run - the run number (type "ALLBEAM", "SICOSM" or
"SIPED")
seq - the sequence number
example:
.x si_ped_gain_calc.C(7269,0);
- This will lookup the location of the rawdata file in the database. If this does not
work, you can specifiy the loaction yourself. See Finding
Raw Data Files for instructions on finding which subdir the file is located in.
.x
si_ped_gain_calc.C(run,seq,subdir);
subdir - subdirectory off of $DATA in which the PhoRaw file is located
example:
.x si_ped_gain_calc.C(7269,0,"1");
- This macro will demand the expert to validate the runs. See Manual
Validation Walkthru.
- Follow the instructions for processing pedestals exactly. The
macro will know which type of run the data is and will calculate gains automatically on
"SICAL" runs.
To view pedestals/noise from runs that were validated and written to the database, do
the following.
- Log into phast.phobos.bnl.gov as shift.
- cd to SHIFT_MACROS.
- Start phat.
- Use the histpeds_from_db.C macro:
.x histpeds_from_db.C(run,depth);
run - the run to view peds from
depth - 0 for FEC level, 1 for string level
example:
.x histpeds_from_db.C(7269,0);
When pedestals are processed, the pedestal and noise values are stored in a root file,
in the $CALIB directory. The filename begins with "pedcalc" and contains the run
and sequence numbers. To view the pedestals and noise values from this file, use the
histpeds_from_file.C macro:
- Log into phast.phobos.bnl.gov as shift.
- cd to SHIFT_MACROS.
- Start phat.
- Use the histpeds_from_file.C macro:
.x histpeds_from_file.C(file,depth);
file - the filename, including directory
depth - 0 for FEC level, 1 for string level
example:
.x histpeds_from_file.C("$CALIB/pedcalc_007269s000.root",0);
To process pedestals by hand, do the following.
To process pedestals by hand, do the following.
The pedestal and gain validation modules have the capability to output both an ntuple
and a text file. By default, the ntuple is not written out. The text file currently is
written to the $CALIB directory and contains all potential problems the module finds. The
text file will have a name similar to "PedValMod_ErrOut_6999.txt" (for pedestal
runs) or "GainValMod_ErrOut_7105.txt" (for gain runs). The name of the ntuple
name is can be set by the "SetNTFileName()" function of the validation module,
TPhPedValMod for peds and TPhGainValMod for gains. The default name is
"GainValMod_ntuple.root" for gain runs and "PedValMod_ntuple.root" for
ped runs. Use the "SetWriteNTuple()" function to tell the module whether or not
to write the ntuple to a file.
The text file can be used to tell which chips have drifted a significant amount. Look
for the lines in the file similar to:
- For gain runs,
Gain Diff: Run 7105, FEC/Str/Chp 1/0/1, GainDiff -0.220485, AveGain 1, GainRef 1.22048
- For ped runs,
Big PedDiff: Run 7267, FEC/Str/Chp 8/1/5, AvePed 407.546, AveNoise 2.26157, AvePedRef
678.901, PedDiff 271.355, Cut 12
Big NoiseDiff: Run 7267, FEC/Str/Chp 8/1/5, AvePed 407.546, AveNoise 2.26157, AveNoiseRef
2.71722, Noise Diff -0.455645, Cut 0.3
Basically, search for "Gain Diff", "Big PedDiff" or "Big
NoiseDiff". The information displayed on those lines should be self
explanatory.
The ntuple is called "nt" in the file and contains the following branches.
- In Pedestal runs,
- "run" - run number (entires for both reference and current)
- "avped" - pedestal average of chip
- "avnoise" - noise average of chip
- "avpeddiff" - pedestal drift (current minus reference)
- "avnoisediff" - noise drift (current minus reference)
- "ped" - pedestal on this channel
- "noise" - noise on this channel
- "FEC" - FEC #
- "string" - string #
- "chip" - chip #
- "chan" - channel # on chip
- "padx" - padX of this channel
- "pady" - padY of this channel
- "dcmask" - dead channel mask flag of this channel
- In Gain runs,
- "run" - run number (entires for both reference and current)
- "avgain" - gain average of chip
- "avgaindiff" - gain drift (current minus reference)
- "gain" - gain on this channel
- "FEC" - FEC #
- "string" - string #
- "chip" - chip #
- "chan" - channel # on chip
- "padx" - padX of this channel
- "pady" - padY of this channel
- "dcmask" - dead channel mask flag of this channel
Thus, the gain drift plots can be made with the following code:
Int_t refRun = 7105; // reference run number

  TFile f("GainValMod_ntuple.root"); // get the output file

  TNtuple* nt = f->Get("nt"); // get the ntuple from the file

  Char_t cuts[128]; // the cuts string

  /* don't plot diffs for reference run (they're all 0) */

  /* only plot connected channels (padx,pady non-negative) */

  /* only plot diff once for each chip (select a channel number) */

  sprintf(cuts,"run!=%d && padx>=0 && pady>=0 &&
  chan==5",refRun);

  nt->Draw("avgaindiff",cuts);
- The validation module works by calculating the average ped/noise/gain on a chip for both
the current run and a reference run. If the average ped/noise/gain on a chip has changed
significantly since the reference run, there may be a problem. The amounts the
ped/noise/gain are allowed to change without being marked as potentially dangerous are
displayed in the terminal running the ped/gain calculation macro.
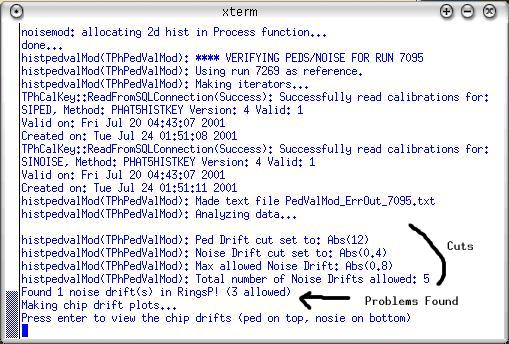
- You will be prompted to press 'enter' before any plots show up. Press enter.
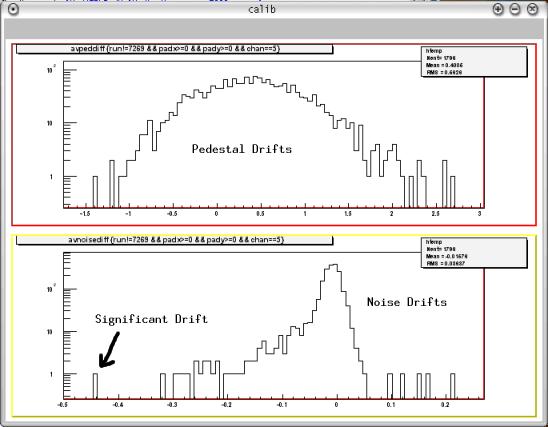
- The first plot shown in manual mode is the distribution of these differences, or
"drifts."
- Drifts are the current chip average minus the reference chip
average.
- For pedestal runs, two plots are shown. The top shows the distribution of pedestal
drifts. The bottom shows the distribution of (common mode corrected) noise drifts.
- For calibration runs, the distribution of gain drifts is shown.
- The distributions should be centered at zero, and there should be very few (if any)
chips outside the cuts indicated. If there are chips outside the cuts, you can find out
which ones they are by looking at the validation module output.
- You will then be asked if you want to print this canvas. Pressing 'y' will save the
plot(s) as a file, $PHATHOME/macros/sigproc/cavas.ps . You can then rename this file and
print it using the lpr command. You will need to open another terminal and log in to phast
to do this.
- Now you can look at the actual ped/noise/gain values. You will be asked whether you want
to do this on the FEC or String level. For most purposes, you will want to use the FEC
option. The only time you may want to use the String option is if you know where a
specific problem might occur and want to look at it in more detail.
- Two windows will be opened. The large one will display the ped/noise/gain values. The
smaller window will have a list of buttons. The buttons will allow you to browse through
the FECs or Strings.
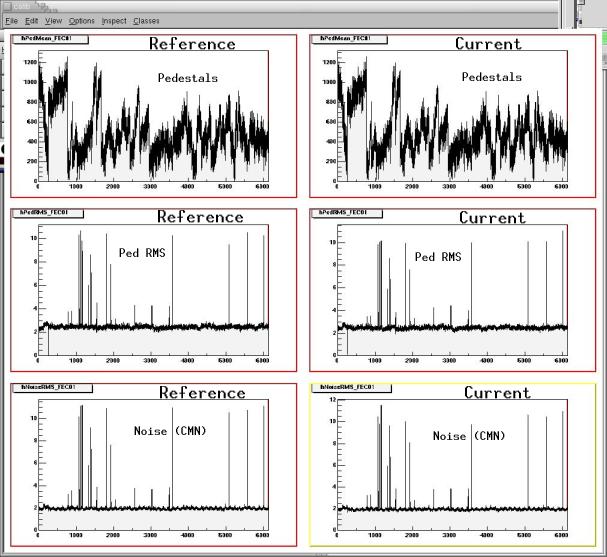
- The left column of graphs shows the reference run values.
- The right column of graphs shows the current run values.
- For pedestal runs, the top plot shows the pedestal values, the middle plot shows the
pedestal RMS and the bottom plot shows the common mode corrected noise. When the pedestal
validation module indicates a noise drift, it is referring to the common mode corrected
noise (bottom plots).
- From here you can look for latchup (pedestal values will be flat), see if the bias might
not have been turned on (noise will be systematically higher) or find which chips are not
gain calibrating.
- You can click the "Print" button to save the large canvas as a file,
$PHATHOME/macros/sigproc/fcanvas.ps . You can then rename this file and print it using the
lpr command. You will need to open another terminal and log in to phast to do this.
- When you are done looking at these plots, click the "Close Plots" button at
the bottom of the button bar.
- You will now be given some advice and asked to validate the run. For pedestals, if the
validation module thinks it found problems, the advice will usually tell you not to
validate unless the current sequence is the only or the last sequence in this run on which
pedestals can be calculated. The idea being that the pedestals for some other sequence in
this run may validate with no probelms.
- Pressing 'y' will write the ped/noise/gain values to the database. It will also put a
comment in the run logbook, listing what problems the validation module found and
indicating that the user validated the run. You should then make a note in the shift
logbook.
- Entering any other key will cause the ped/noise/gain values not to be written to the
database.
The raw data files are stored in /mnt/data/0, 1, etc.
The directory to which a specific run has been written can be found on the web. From
the Counting House Portal, open the Run Logbook, Last 50 Runs. Find the
run you wish to process. Look in the Details for the run. This brings up a window
displaying Run information, Operator Comments and Sequences. Open the Raw Log next
to the run number. This will bring up another window displaying the Details of the run.
The location of the raw data file is shown in the Comments column of the START_SEQ action.
Example:
The details of run 6314 (an SIPED type run) has the following comment for the START_SEQ
action:
/data/1/PhoRaw006314s000.root:/
Thus, one would analyze this run by
.x histpedcalc.C(6314,0,"1");
If you have problems, contact: