| Oracle7 Server Manager User's Guide | Library |
Product |
Contents |
Index |
| Oracle7 Server Manager User's Guide | Library |
Product |
Contents |
Index |
Table 10 - 1 describes the monitors available in Server Manager. For a detailed description of each monitor, see Chapter 11, "Monitoring System Performance."
Additional Information: The location of the UTLMONTR.SQL script is platform dependent. For information about running UTLMONTR.SQL, see your operating system-specific documentation.
You can also grant specific users access to the individual views used by each monitor. For a list of the views used by each monitor, see Chapter 11, "Monitoring System Performance."
For monitors that include statistics related to time, you may want to set the initialization parameter TIMED_STATISTICS to TRUE. When TIMED_STATISTICS is TRUE, Oracle gathers timed-based statistics. If TIMED_STATISTICS is FALSE, statistics related to time are set to zero. For example, the statistics for read time and write time in the File I/O Monitor are not collected if TIMED_STATISTICS is FALSE.
For more information about the TIMED_STATISTICS parameter and setting initialization parameters, see the Oracle7 Server Administrator's Guide.
When you start a monitor, the monitor is connected to the same database as the window from which you started the monitor and shows statistics for that database instance.
When you choose Monitor from the File menu or execute the MONITOR command from a SQL Worksheet, the Monitor dialog box appears. The following figure illustrates the Monitor dialog box.
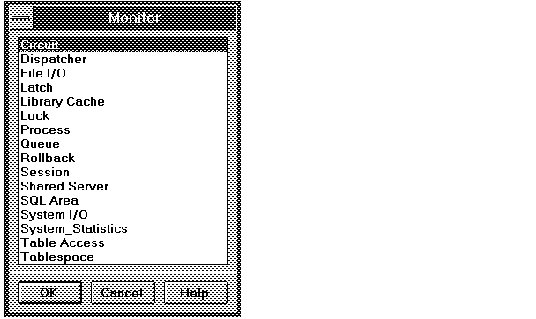 Figure 10 - 1. Monitor Dialog Box
In the Monitor dialog box, you select the type of monitor to start, and then click OK to start the monitor. You can also start a monitor by double-clicking its type in the scrolling list.
If the monitor you selected has already been started, Server Manager brings that window to the front. You may run only one monitor of each type for each instance to which you are connected.
The following figure illustrates a monitor window. Only the left-most columns are displayed. To view additional columns, you need to scroll the column list to the right.
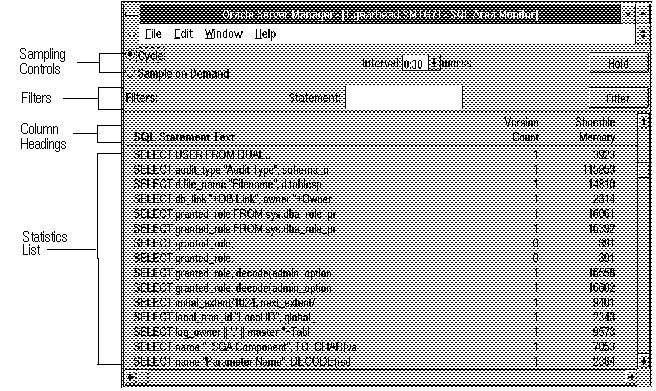 Figure 10 - 2. A Monitor Window
By default, the statistics are sorted on the first column. You can sort a statistics list on another column by clicking that column heading. A column name appears in bold to indicate that the statistics list is sorted on that column.
A few monitors contain columns on which you cannot sort the statistics list. When you click the column heading for one of these columns, the statistics list is not sorted again.
Note: When you click a column heading to sort on that column, a new sample is automatically taken.
The following figure illustrates setting the sampling interval.
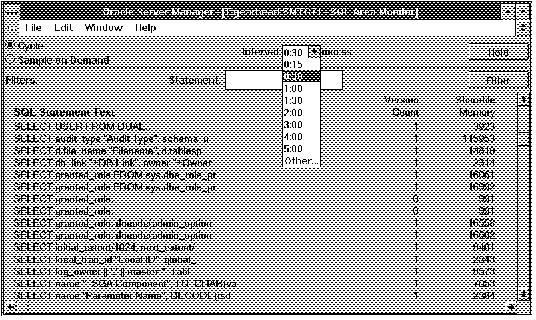 Figure 10 - 3. Setting the Sampling Interval
The Interval pop-up menu contains several predefined sampling intervals that you can select from. You can also specify a different interval by choosing Other from the Interval pop-up menu.
When you choose Other, the Other Interval dialog box appears. The following figure illustrates the Other Interval dialog box.
 Figure 10 - 4. Other Interval Dialog Box
In the Other Interval dialog box, you can specify a sampling interval in minutes and seconds. The minimum sampling interval is 15 seconds. The maximum is 100 minutes and 39 seconds, which you can express as 99 minutes and 99 seconds in the Other Interval dialog box.
When sampling cyclically, clicking the Hold button allows you to suspend sampling. The Hold button is replaced with a Resume button and the current statistics are not refreshed. To resume sampling, click Resume.
To sample statistics on demand, click Sample on Demand. The Hold button is replaced by a Sample button. Click Sample each time you want to sample statistics. The following figure illustrates sampling on demand.
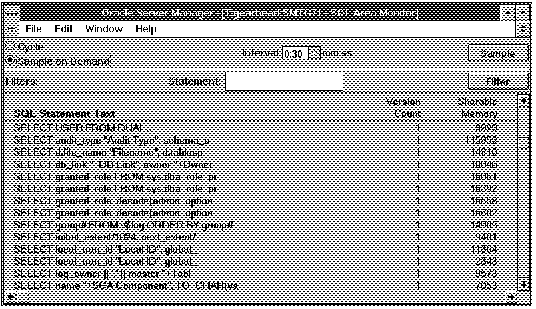 Figure 10 - 5. Sampling on Demand
For non-numeric filters, you may use the SQL wildcard characters underscore (_) and percent sign (%). An underscore represents a single character; a percent sign represents any number of characters. A percent sign is implicitly added to the end of a filter text string.
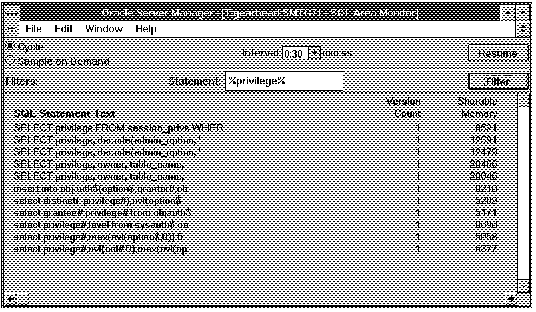 Figure 10 - 6. Using Filters in a Monitor
In the filtering example in Figure 10 - 6, note that the percent sign wildcard character is used in the Statement filter. Statistics are displayed only for statements that contain the text string "privilege".
When there is more than one filter field, the filters are AND-ed together. That is, only statistics that match all the filters are displayed.
By default, the filter text entry fields are empty. If a filter text entry field is empty, then all values match that filter.
|
Prev Next |
Copyright © 1996 Oracle Corporation. All Rights Reserved. |
Library |
Product |
Contents |
Index |