- Previous message: Flemming Videbaek: "data summary for dA"
- Maybe in reply to: Flemming Videbaek: "data summary for dA"
- Messages sorted by: [ date ] [ thread ] [ subject ] [ author ] [ attachment ]
Hi All,
I updated BrModuleMatchTrack{h,cxx} by including a new diagnostic
histogram which plots number of good matched tracks per
1000 event versus the event number (in k). This is a very easy tool
to check which part of the run can be really counted as a "good" or
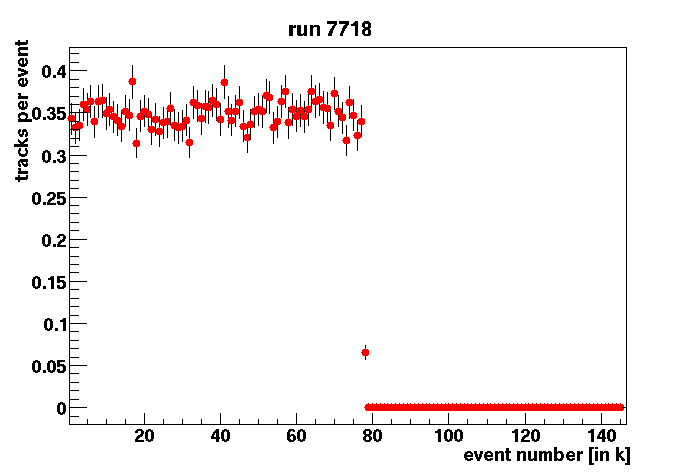
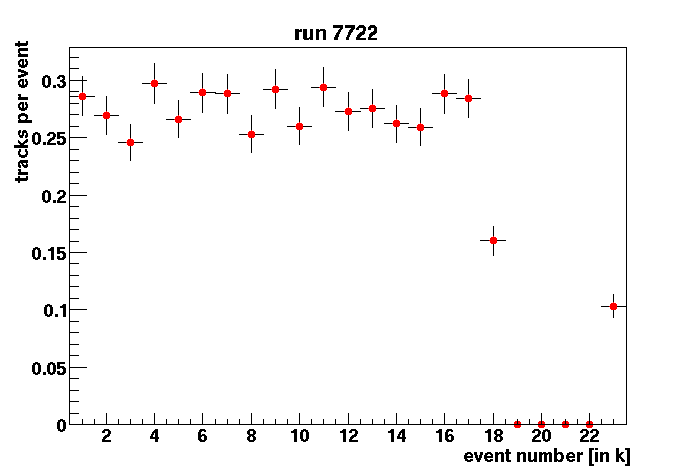
achieved data. E.g. we detected that T1 tripped at some point in
run # 7718 and 7722. The two attached plots, run7718.gif and run7722.gif
show how the loses (because of this trips) can be quantified by looking at
the hGoodTracksVsEvNo.

It can be also useful for people who are doing the data analysis to
find out which part of the run has to be skipped in order to
avoid a wrong normalization.

I added  hGoodTracksVsEvNo in BrModuleMatchTrack so, it is active for
any pair of tracking detectors used do to track matching.

Because of some other commitments of minor changes to dc related
code I updated the BRAT revision number - a new tag is BRAT-2.7.3.

Regards
Pawel.


> This is to remind / tell people that the shiftters page contains a
> link to data runs taken, including some judgement if runs are not to
> be included. There can of course be problems that are not uncovered
> until additional analysis is performed. Likewise some runs discarded
> initialy may turn out to have acceptable background.
>
> http://pii3.brahms.bnl.gov/~operator/shifts/dASummary.htm
>
> The aim is to have this updated on a daily basis.
>
> ------------------------------------------------------
> Flemming Videbaek
> Physics Department
> Brookhaven National Laboratory
>
> tlf: 631-344-4106
> fax 631-344-1334
> e-mail: videbaek@bnl.gov


- Next message: Apache: "Shift report 20030204 16:00-24:00"
- Previous message: Flemming Videbaek: "data summary for dA"
- Maybe in reply to: Flemming Videbaek: "data summary for dA"
- Messages sorted by: [ date ] [ thread ] [ subject ] [ author ] [ attachment ]
This archive was generated by hypermail 2.1.5 : Tue Feb 04 2003 - 13:38:37 EST