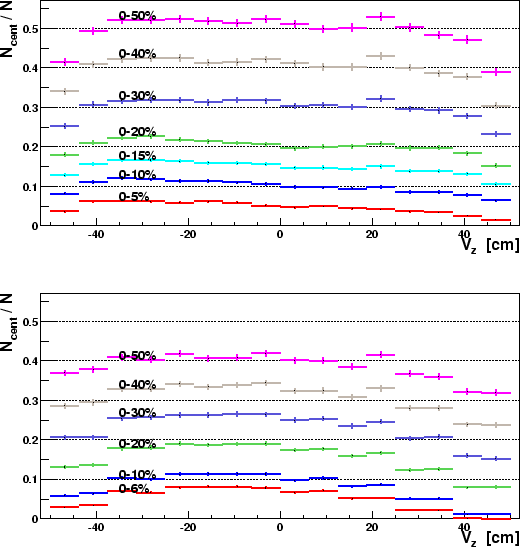
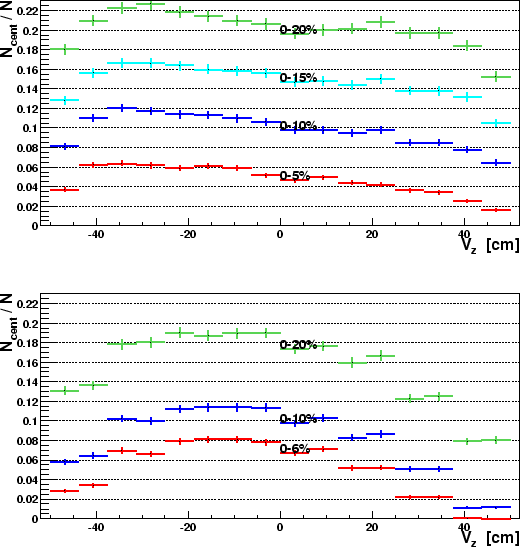
In this section the centrality cut method described in this note and the Get_centrality function3 are investigated.
It is fairly simple to check if, say a 10 percent centrality cut
really corresponds to the 10 percent of events with the highest
multiplicity. From a sample of ![]() minimum bias event the cut should
give
minimum bias event the cut should
give ![]() events -- in other words
events -- in other words
![]() .
.
Approximately 400,000 minimum bias events (i.e. inclusive trigger 4
with at least one hit in the tiles) from run 2481 have been
analysed. For 16 vertex bins the ratio ![]() has been found
for the different (inclusive) centrality cuts in the two methods.
Figures 5 and 6 (blow-up) show the
results.
has been found
for the different (inclusive) centrality cuts in the two methods.
Figures 5 and 6 (blow-up) show the
results.
 |
 |
It's clear from the figures that the centrality cuts are improved, but
they are still not perfect. It seems that there is some systematic
effect on the edge bins, which means that the centrality of events
with ![]() 40cm is still overestimated. The
40cm is still overestimated. The ![]() ratio
for the 5%, 10% and 15% cuts shows a systematic
decrease for growing
ratio
for the 5%, 10% and 15% cuts shows a systematic
decrease for growing ![]() . We believe that these effects are
due to the improper
. We believe that these effects are
due to the improper ![]() fits. We will systematically investigate
the fitting, and try to come up with a better calibration.
fits. We will systematically investigate
the fitting, and try to come up with a better calibration.