Correlation between ADC noise and TDC noise in T0.
Last updated 4/12/2003 9:35 AM
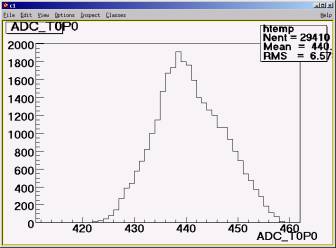
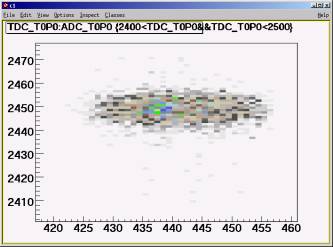
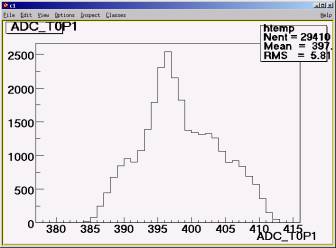
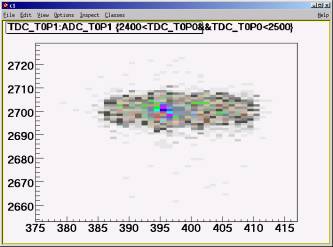
The shown below are the ADC spectra and TDC vs ADC plots for some of the T0 channels taken for Time Calibrator runs. Only events with second calibration peak were selected.
|
Fig. 1a. T0P0 ADC. FBTIME Run 11925. |
Fig. 1b. T0P0 TDC vs ADC. |
|
Fig. 2a. T0P1 ADC. FBTIME Run 11925. |
Fig. 2b. T0P1 TDC vs ADC |
|
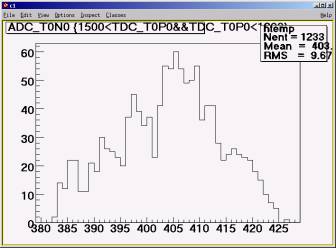
Fig. 3a. T0N0 ADC. FBTIME Run 11933. |
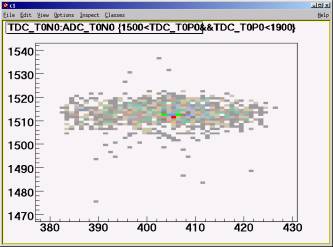
Fig. 3b. T0N0 TDC vs ADC |
|
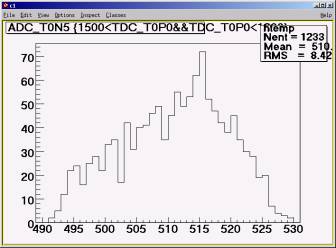
Fig. 4a. T0N5 ADC. FBTIME Run 11933 |
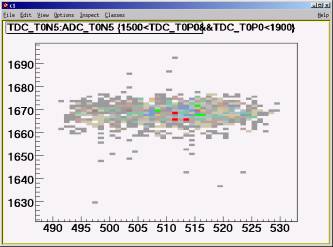
Fig. 4b. T0N5 TDC vs ADC |
|
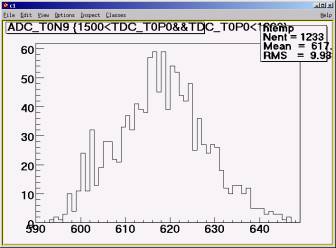
Fig. 5a. T0N9 ADC. FBTIME Run 11933. |
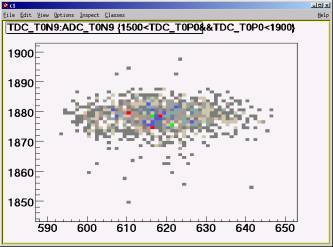
Fig. 5b. T0N9 TDC vs ADC |
|
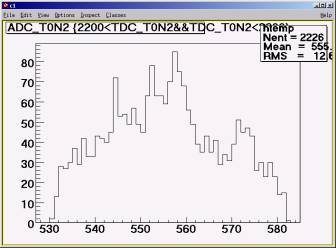
Fig. 6a. T0N2 ADC. Run 11605. Only T0N2 and T0P5 are enabled. |
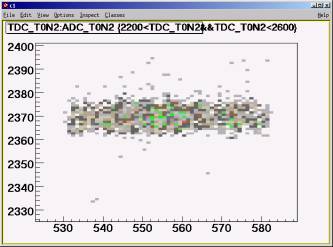
Fig. 6b. T0N2 TDC vs ADC |
|
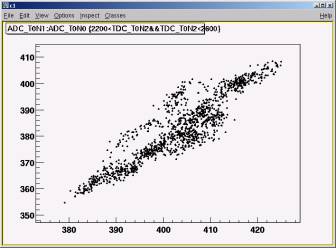
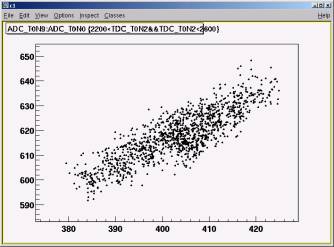
Fig. 7a. ADC T0N1 vs N0. Run 11933. Near wires. |
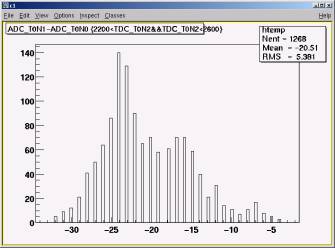
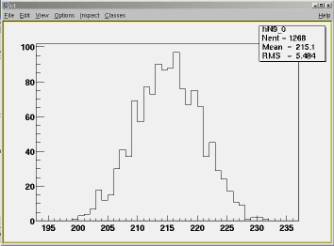
Fig. 7b. ADC T0N1-N0 |
|
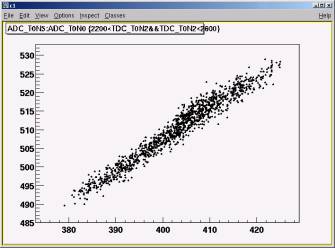
Fig. 8a. ADC T0N5 vs N0. Run 11933. Mid wires. |
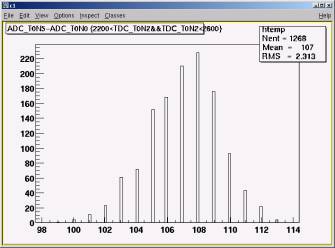
Fig. 8b. ADC T0N5-N0 |
|
Fig. 9a. ADC T0N9 vs N0. Run 11933. Far wires |
Fig. 9b. ADC T0N9-N0 |
|
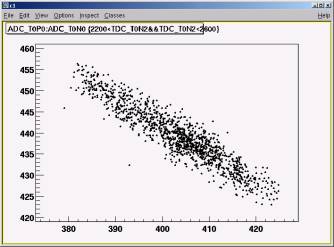
Fig. 10a. ADC T0P0 vs N0. Run 11933. Near wires. |
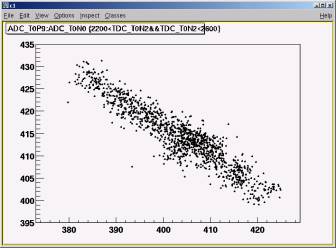
Fig 10 b. ADC T0P9 vs N0. Run 11933. Far wires. |
Summary:
- There is no correlation between ADC noise and TDC noise on T0. See fig. 1a-6b.
- The ADC noises on different channels of the same side of T0 are highly correlated. See fig. 7a-9b.
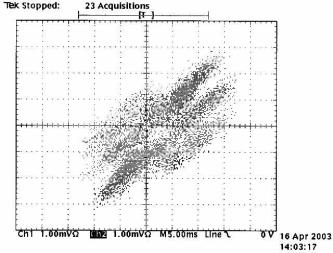
- The ADC noises on different sides of T0 are highly anti-correlated. See fig. 10a,10b
TOF Nebulae
Noise correlations between different TOF channels. Time Calibrator run 11933.
|
Fig. 11a. ADC TOF TB63U vs T0N0 |
Fig. 11b. ADC TOF TB63U vs TB60U. Neighboring channels. |
|
Fig. 12a. ADC TOF TB63U vs TB63D. The same slat. |
Fig. 12b. ADC TOF TB63U vs TC60U. Different walls. |
|
Fig. 13a. ADC TOF TC63U vs T0N0 |
Fig. 13b. ADC TOF TB63U vs TC60U. Only first 20K events analyzed out of 40 K. |
|
Fig. 14a. ADC TOF TC61U vs TC61D |
|
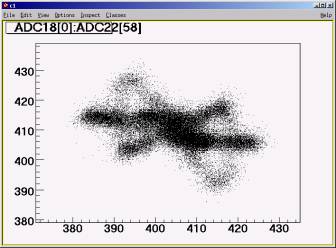
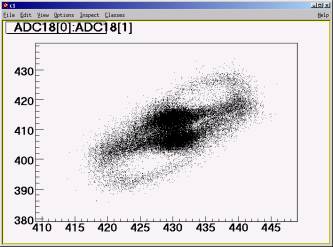
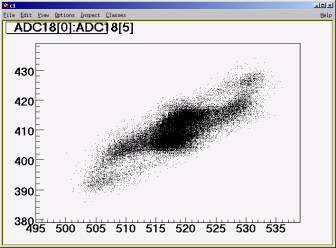
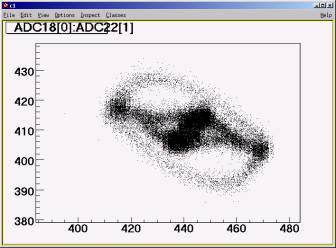
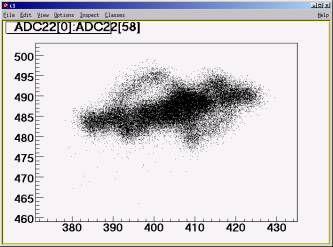
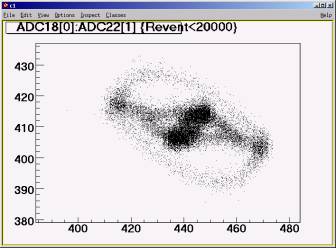
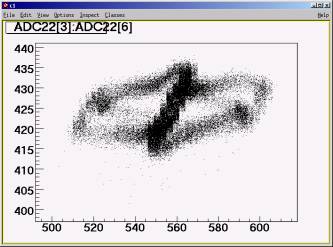
The same plots but for normal run 11971s2. The same behavior but twice bigger swing.
|
Fig. 15a. ADC TOF TB63U vs T0N0 |
Fig. 15b. ADC TOF TB63U vs TB60U |
|
Fig. 16a. ADC TOF TB63U vs TB63D |
Fig. 16b. ADC TOF TB63U vs TC60U |
|
|
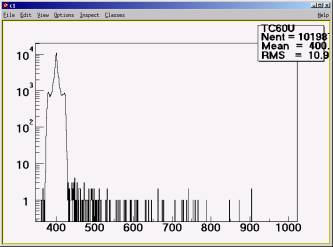
Fig. 17b. ADC of TC60U. |
|
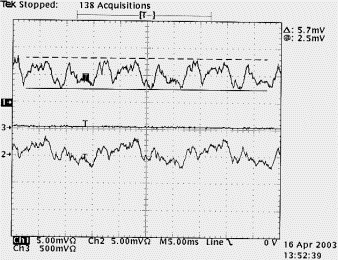
Fig. 18a. Ground noise on T0P0 (ch1) and T0N0 (ch 2). Both signals have peak-to-peak amplitude 6 mV, the T0P0 have positive offset 4 mV. The picture was taken during RHIC restricted access. |
Fig. 18 b. T0P0 (ch1) vs T0N0 (ch2) |
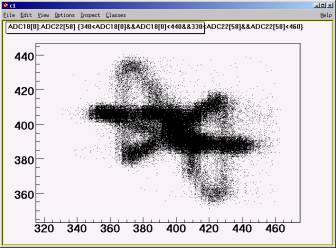
Summary:
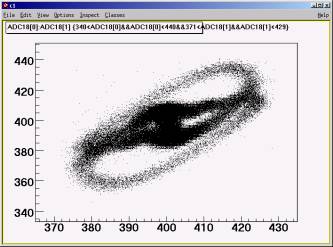
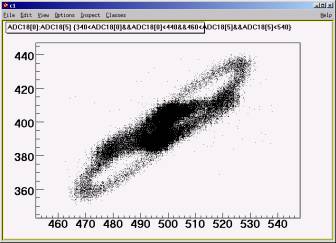
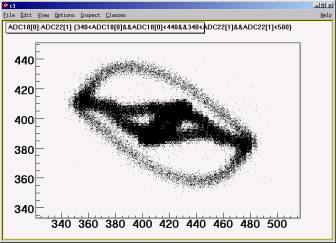
- The noise correlation between different TOF channels resembles the photos of the nebulae and galaxies from the Hubble telescope. Do they have the similar noise problem at the Hubble?
- The correlation pattern is the same for both Time Calibrator run and for normal run. Although the noise amplitude is twice bigger in the normal runs. Compare Fig. 11a and 15a, 11b and 15b, 12a and 16a, 12b and 16b.
- The correlation pattern is stable. It is the same for 1000 events as for 10000 events.
- Some ADCs (i.e. TC60U) have the pedestal spread big enough to smear the MIP peak. See Fig. 16b. and 17b.