12/8/2002 1:04 AM
Reference histogram from run 10013:
Obtained using:
df = new TPhDAQFile("PhoRaw010013s000.pdaq");
.x $PHATHOME/macros/compression/showFEC.C(1)
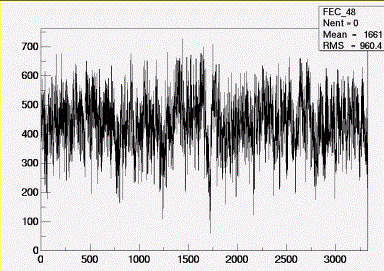
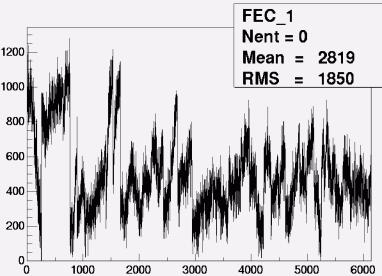
Fig. 212071 and 2. Normal.
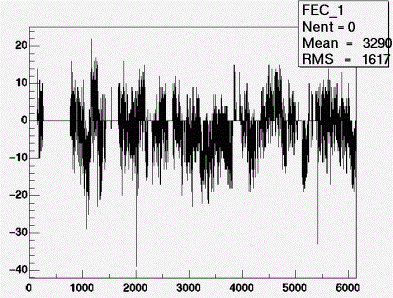
Fig. 212073. Troubled run 117
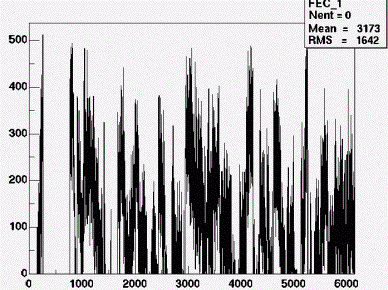
Fig.
with TPhRawHitFEC::fRecoverPedestals = kFALSE;
I would say this looks like 212071 subtracted from 512
12/8/2002 3:28 PM
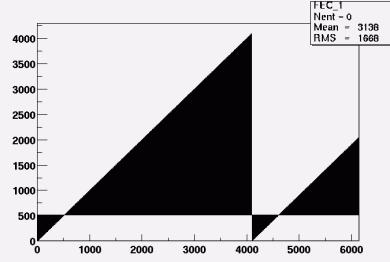
Fig. 2120801. Simulated Silicon with TPhRawHitFEC::fRecoverPedestals = kFALSE
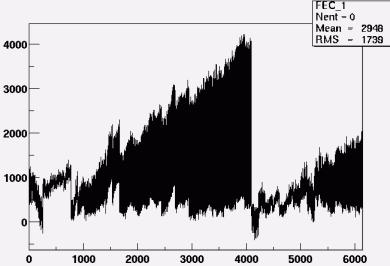
Fig. 2120801. Simulated Silicon with TPhRawHitFEC::fRecoverPedestals = kTRUE
In this case:
root [16] TPhRawHitFEC *fec = (TPhRawHitFEC
*)rawdata->FindObject("FEC_1")
root [17] fec
(class TPhRawHitFEC*)0x91e4900
root [18] fec->Print()
FEC# 1 trailer:
0: U = 0000 L = 0000
2: U = 0000 L = 0000
4: U = 0000 L = 0000
6: U = 0000 L = 0000
8: U = 0000 L = 0000
10: U = 0000 L = 0000
12: U = 0000 L = 0000
14: U = 0000 L = 0000
RunMode, FEC Number: 0000
FIFO Error :
0000
ShiftOut Error :
0000
EOF bit patterns :
0000
MDC error code :
209c
Half miss channel :
0a0c
MDC status code :
02b0
Synchronisation :
5800
FEC# 1 - unpacked hits:
String 0[768]:
0:1151
1: 973 2: 878 3: 989
4: 963 5:1194 6:1146
7: 387
8: 937
9: 892 10: 984 11: 857
12: 930 13: 979 14: 931
15: 428
16: 917
17: 943 18:1005 19: 986
20:1048 21: 896 22:1246
23: 454
24: 782
25: 979 26: 987 27:1083
28:1012 29:1046 30: 977
31: 452
32: 799
33: 905 34: 929 35:1094
36:1076 37: 962 38:1017
39: 390
40: 901
41: 855 42: 862 43: 880
44: 832 45: 992 46: 952
47: 474