11/7/2002 5:08 PM FASTBUS problem
fastbus > 0x1bbf538 (t1): Read/Write mismatch, slot 6 (r=11,w=12). DP=11e
0x1bbf538 (t1): Read/Write mismatch, slot 7 (r=11,w=12). DP=11e
This happens at the end of Busy if new trigger is coming.
2 reasons.
1) Metastability in the L0 trigger. The Busy was applied to the Clear of the D trigger. This was solved by providing short clear pulse at the beginning of the Busy.
2)
Fastbus does not read the event.
The Fastbus Busy is longer than Silicon, 1.8 ms. What happens, the Fastbus does
not detect the second event. But how it is possible? EMM should detect that it
is not responding. After checking emm_wait_handshake_bits in EMM trigger found
that it was 0x400 that means only silicon in handshake. Setting it to 0x440 solved
problem.
emm_wait_handshake_bits should be 440 always!!!
11/8/2002 8:38 AM
Left the system running overnight with 1 Hz, double trigger, the second trigger adjusted to the end of Busy.
Got one occasion in FB:
0x1bbf538 (t1):
Read/Write mismatch, slot 6 (r=43,w=44). DP=10b
0x1bbf538
(t1): Read/Write mismatch, slot 7 (r=43,w=44). DP=10b
What is good it was accompanied by EMM:
silicon EMMTrigger > interrupt: (4)Warning. Missing handshake from Fastbus
0x13cd850
(t1): Error. TML1 was blocked due to missing handshake from Fastbus N
ow is okey,
Reset L1 veto and continue.
TODO: Unfortunately EMM does not report event number
The EMM at this point:
0 1
2 3 4 5 6
7 8 9 10 11
4: 0100 047b 0000 0000 1b68 0001 b3cf 0000 cf68
cf68 cf68 cf68
5: 0000 0683 0000 0000 c091 0000 0000 0000 0000
0683 0000 0000
6: 1c80 0027 0000 0158 c058 005f 3101 e76e 0000
0000 0000 0000
NOTE: If handshake from FB is active then there is no need for FB Busy.
EMM would block due to delayed handshake
11/12/2002 12:47 PM Modified TML0
After rebooting:
0 1
2 3 4 5 6
7 8 9 10 11
4: 10ff 04cb 4000 0000 0000 0100 0000 0000 0000
0000 0000 0000
5: 1114 0683 0000 0000 0000 0000 0000 0000 1114 0683
0000 0000
6: 0480 8027 0440 8100 0000 0000 0000 0000 0000
0000 0000 0000
After rc_start(RUN_TEST);
silicon EMMTrigger > 0x17ff148 (ttcpwork0):
Starting run type 6
0x17ff148 (ttcpwork0): Started. Trig# 0
pcdp_print
0x13d4ad0 (tShell):
0 1
2 3 4 5
6 7 8 9 10
11
4: 0100 04cb 0000 0000 0000 0000 0000 0000 0000
0000 0000 0000
5: 0000 0683 0000 0000 0000 0000 0000 0000 0000
0683 0000 0000
6: 1c80 0027 0040 8600 0000 0000 e24e 0045 0000
0000 0000 0000
After first event
0 1
2 3 4 5 6
7 8 9 10 11
4: 0100 04cb 0000 4000 0001 089c 0001 0000 0101
0101 0101 0101
5: 0000 0683 0000 0000 0000 0000 0000 0000 0000
0683 0000 0000
6: 1c80 0027 0040 8600 0000 0000 fbf8 013a 0000
0000 0000 0000
11/12/2002 2:04 PM
0x17ff148 (ttcpwork2): Started. Trig# 0
pcdp_print
0x13d4ad0 (tShell):
0 1 2 3 4 5 6 7 8 9 10 11
4: 0100 04cb 0000 0000 0000 0000 0000 0000 0000 0000 0000 0000
5: 0000 0683 0000 0000 0000 0000 0000 0000 0000 0683 0000 0000
6: 1c80 0027 0040 8600 0000 0000 cff6 0075 0000 0000 0000 0000
value = 0 = 0x0
After first event:
0 1
2 3 4 5 6
7 8 9 10 11
4: 0100 04cb 0000 0000 0001 084a 0001 0000 0101
0101 0101 0101
5: 0000 0683 0000 0000 0001 0000 0000 0000 0000
0683 0000 0000
6: 1c80 0027 0000 0101 0001 0001 37cc 01a2 0000
0000 0000 0000
After second event:
0
1 2 3 4 5
6 7 8 9 10
11
4: 0100 04cb
0000 0000 0002 0886 0002 0000 0202 0202 0202 0202
5: 0000 0683
0000 0000 0002 0000 0000 0000 0000 0683 0000 0000
6: 1c80 0027
0040 0102 0002 0002 6a7a 03f6 0000 0000 0000 0000
11/12/2002 3:22 PM. Measured Pause Interval
The L0 board works properly now. The MPI (measured pause interval) counter tested by applying burst of triggers. If T=2 us the MPI shows 0x20, at 4 us – 0x40.
11/13/2002 11:06 AM. Debugging TOFCOSM run
Removed TPhDAQClasses
Before
0 1 2 3 4 5 6 7 8 9 10 11
4: 0100 04cb 8000 4100 0060 0237 bf70 803c 0358 0358 0358 0358
5: 0000 0683 0000 0000 815b 0000 0000 0000 0000 0683 0000 0000
6: 2480 0027 0440 8100 8134 006c 774e 2e56 0000 0000 0000 0000
0 1 2 3 4 5 6 7 8 9 10 11
After rc_start(RUN_TOFCOSM);
4: 0300 04cb 0000 0000 0069 0201 bfa3 803c 3661 3661 3661 3661
5: 0001 0683 0000 0000 8164 0000 0000 0000 0001 0683 0000 0000
6: 1c80 0027 0000 013d 813d 0075 45bf 2efd 0000 0000 0000 0000
[0]: DAQMSG_START 501, 8fffffff
>Suspending EMM
L0 Busy is set
<Suspended
Starting 'TOFCOSM' run for 8fffffff events, current 0
[0]: clientBits=c08
[0]thread_reader1_start: Starting
[0]thread_reader1_start: Reader1 is is being started at priority 4
[0]thread_reader1_start: Launching
[0]Thread reader1: Start
>Resuming EMM.
L1 Busy is reset
[0]reader1: Starting
[0]reader1: data socket opened at port 7000 size 65536
[0]reader1: Client fastbus, at 130.199.65.19:1025
[0]reader1: Started
L0 Busy is reset
<Resumed
[0]reader1: Initializing queue for event 5
[0]phatdaq: Idle.
EQueue: 0x10.5.5.0.4b000
[0]phatdaq: Row5=35.02.01.0.3b0 0000.0000 0028.037c
0.001 MB, 0.000 MB/s. 0.000 MB. Clients 0.0
11/17/2002 L0 problem. Missing gates for TOF
Affected: TOF calibration runs.
The reset for Exclusive TOF and ZCAL triggers was set wrong – from L0RST. If trigger comes during Veto then gate is not generated but event will be accepted after falling edge of the Veto.
Solution: setting of the Exclusive TOF and ZCAL triggers is vetoed.
11/19/2002 9:46 AM
Noticed the data error during online processing:
TPhEvent Name: event_10071_64031
Requested 4 events
#Error in <TPhDAQFile::GetNextEvent>: Stamp in block43=0x13040100
!= 0xDeadFace
0000:e1101300
38d50000 00010413 f0120000 00000000 d50129fa 03010800 f0120000
TPhEvent Name: event_10071_64041
*** Break *** segmentation violation
Restarted at 615049
Got another one:
TPhEvent Name: event_10071_619497
Requested 4 events
#Error in <TPhDAQFile::GetNextEvent>: Stamp in
block43=0x14540100 != 0xDeadFace
0000:e1601400
38a20000 00015414 40140000 00000000 a201f673 03010800 40140000
TPhEvent Name: event_10071_619510
TODO: Check it on the file
Cool, the problem is related to disk activity, it broke just after I started deleting files on the disk:
Requested 4 events
#Error in <TPhDAQFile::GetNextEvent>: Stamp in block43=0x13100100
!= 0xDeadFace
0000:e1181300
38030000 00011013 fc120000 00000000 0301577c 03010800 fc120000
TPhEvent Name: event_10071_621655
*** Break *** segmentation violation
11/25/2002 9:28 AM Interrupt is working on vmeroc
Note: The Wiener crate although it have a sticker “Automatic Daisy Chain” does not deliver IACKIN to the board in the middle of crate. When I moved EMSD next to the PPC it starts reacting to interrupt properly:
IACK D07 IACKIN IRQ
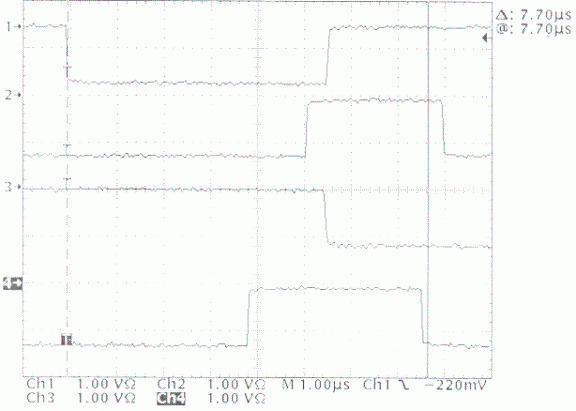
Fig 0211250900. Interrupt request processing in EMSD.

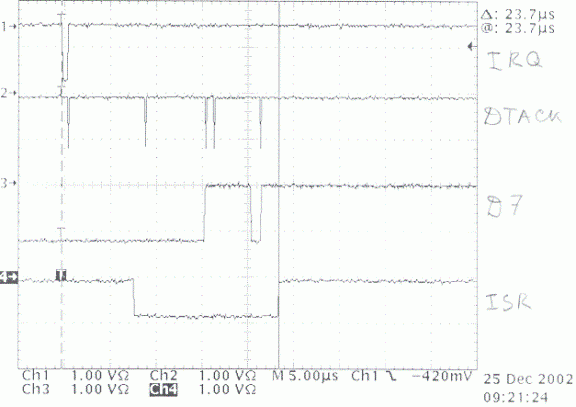
Fig 0211250921. Interrupt Service Routine for EMSD.
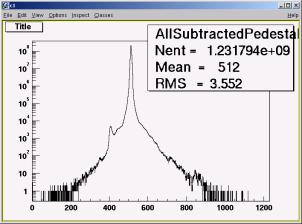
Fig. 0211251100. Pedestals processed for file 10013s0, 8800 events
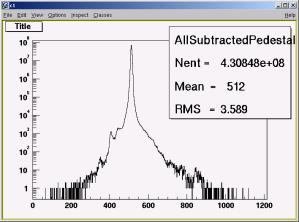
Fig. 0211251100. Pedestals processed for file 10013s0, 3000 events
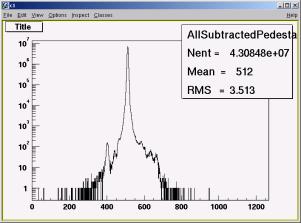
Fig. 0211251105. Pedestals processed, file 10013s0, 300 events