
The purpose of Fastbus data validations is:
Fastbus data validation does not determine the quality of the digitized data. DV modules such as TPhTOFDVMod and TPhTriggerDVMod were created for this purpose. Fastbus data validation just determined whether the pedestal and gain data being used in the current analysis are correct. If the Fastbus data are not validated, the pedestal and gain calibration data stored in the DB must be adjusted in order to ensure that proper gain and pedestal data are being used.
Note: changes in TDC timing are not always a result of changes in TDC calibration. Frequently, they are a direct result of changes in the detector itself and/or changes in the timing of the trigger circuit.
The Fastbus data validation will produce 3 series of histograms and graphs. Each of these is here discussed in more detail, and key points to examine are discussed. The graphs shown here are the result of data validation of run 7095. Several problems appeared as a result of examining these histograms. They were corrected by adding new pedestal data to the database, and fixing a software problem in TPhFBDVMod.
ADC Pedestal and Noise Distributions
This canvas shows graphs and histograms that can be used to monitor changes in the ADC pedestal and noise distributions. During data validation, the Fastbus data are pedestal subtracted using the most recent calibration data. As part of the data validation analysis, the position and width of the pedestal peak is determined. This information can be used to determine the pedestal shift and the noise shift, between the current run and the most recent pedestal calibration run. The shift in pedestal and pedestal noise are shown as function of the (100*FBSlot + ADC Channel) in the middle histograms (top middle: pedestal shift , bottom middle: noise shift). The Paddle and Cherenkov data (FB Slot 6) show up between channels 600 and 663, the ZCal data (FB Slot 7) show up between channels 700 and 763, and the TOF/T0 data (FB Slot 18 - 25) show up between channels 1800 and 2563. In the above histograms, there is little change in pedestal position and pedestal noise for the trigger counters, but significant changes for the exist for the TOF/T0 channels. The significance of a change in pedestal position depends on the pedestal noise (e.g. a shift of the pedestal by 2 channels is not very significant for a channel where the pedestal noise is 10 channels). In order to take this noise dependence into consideration, the histograms shown on the right show the fractional pedestal shift (pedestal shift/noise) and the fractional noise shift (noise shift/noise). Finally, the average fractional pedestal shift (averaged over all ADC channels) and the average fractional noise shift (averaged over all ADC channels) are shown as function of sequence number in the graphs shown on the left. When examining this canvas, please focus on the following aspects:

TDC Distributions
This canvas shows the measured TDC distributions (in ns) for the 6 sub detectors that are using the Fastbus crate for digitization of pulse height and timing information. These sub detectors are the Paddle counters (top left), the Cherenkov counters (bottom left), the ZCal (top middle), the T0 counters (bottom middle), the TOF TB counters (top right), and the TOF TC counters (bottom right). When examining this canvas, please focus on the following aspects:
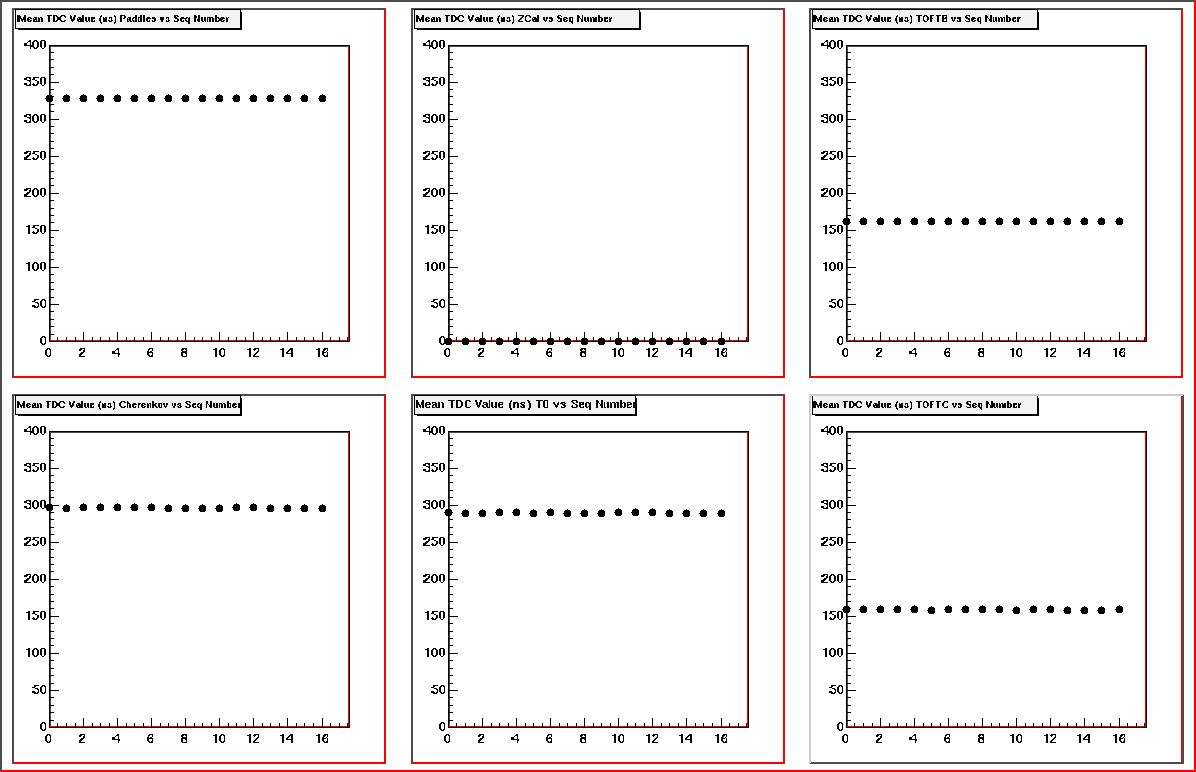
Mean TDC Distributions
This canvas shows the mean of the measured TDC distributions (in ns) for the 6 sub detectors that are using the Fastbus crate for digitization of pulse height and timing information as function of sequence number. These sub detectors are the Paddle counters (top left), the Cherenkov counters (bottom left), the ZCal (top middle), the T0 counters (bottom middle), the TOF TB counters (top right), and the TOF TC counters (bottom right). When examining this canvas, please focus on the following aspects: