Last Updated on
Tuesday, August 19, 2014 at
15:42:16. by Author: Nigel George
Data Validation, General Information/Help
Contents
Description of the steps
- Data is taken and written onto the DAQ disk (/data/0 ,or, 1 ....3)
- Data is then handled by the data mover, and pedestals are run, and data is sunk to HPSS
and data validation is run on "ALLBEAM" triggers.
- When data validation is finished, the output is put into $DV_OUT/pr01, disk on rcf.
(This disk is viewable from any of the rcas400x nodes). The output includes , the hits
file (with CMN correction applied and without), the trigger tree, dv tree, the object
manager, a log file (shows output from macro), and an error file (shows error that
occurred while running). A copy of the hit files is put into HPSS in the following
location: /home/phobreco/pr01/recon
Summary
$DV_OUT/pr01
err/DateXXXXX_TimeZZZZ_Set1_[Run Number]s[Seq Number]_ONLV_X_X_X.err
log/DateXXXXX_TimeZZZZ_Set1_[Run Number]s[Seq Number]_ONLV_X_X_X.log
trgtree/TrgTree[Run Number]s[Seq Number]_ONLV_X_X_X.root
objmgr/PhoOM[Run Number]s[Seq Number]_ONLV_X_X_X.root
dvtree/DVTree[Run Number]s[Seq Number]_ONLV_X_X_X.root
HPSS: /home/phobreco/pr00/recon
PhoHit[Run Number]s[Seq Number]_ONLV_X_X_X.root
PhoDST[Run Number]s[Seq Number]_ONLV_X_X_X.root
- When the job is finished, use the online, from phucsia, to view the dv tree. This file
has the summary histograms. Examine each of these histograms (and compare them to their
reference histograms)
- What ever you find out about the run, put into the comments associated with that run.
Click here for how to do this.
The Data Monitor DeskTop
The data monitor window on phucsia, looks like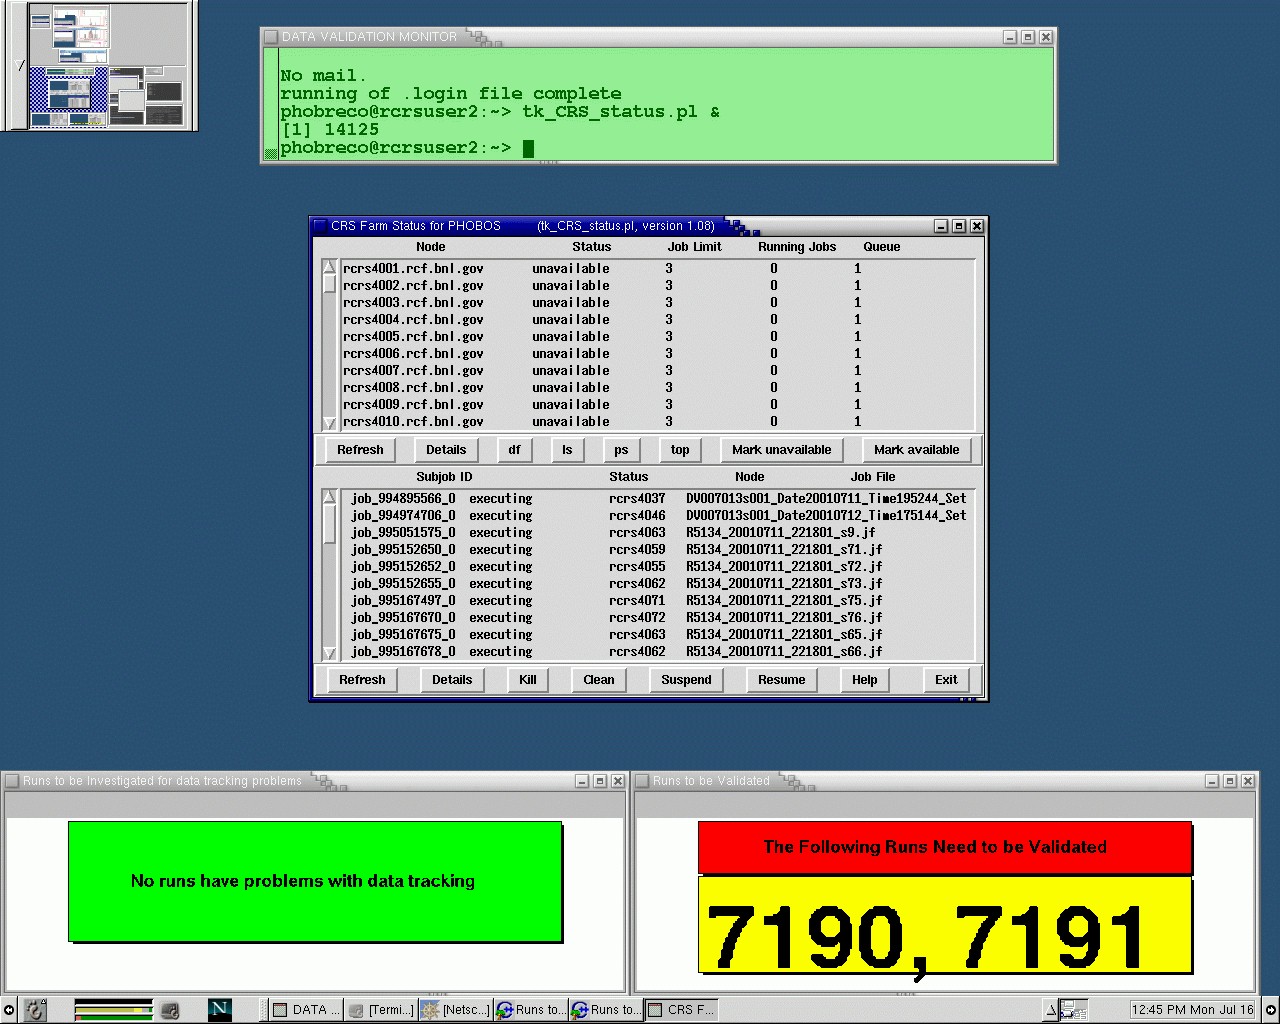
The CRS status window, gives info on the jobs in the cRS computer farm.
The "Runs to be investigated for data tracking problems", is the window that
indicates runs that need to be investigated.
The "Runs to be Validated" is the window that indicates runs that need to be
validated.
The Data Validation Desktop
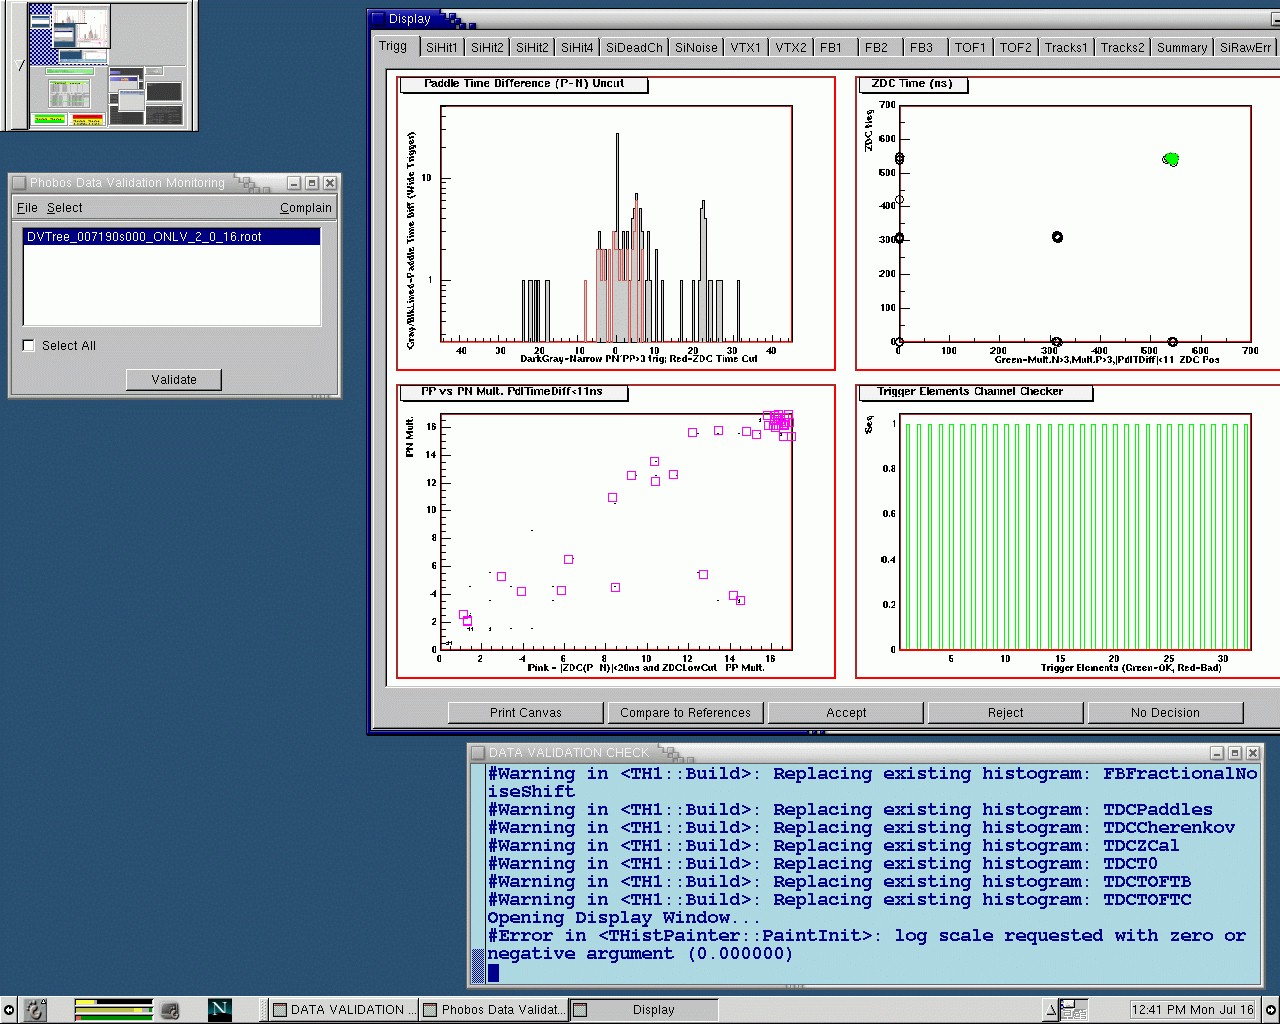
- Ensure CRS monitor running on phucsia (look for window entitled "CRS Farm Status
for Phobos", for description click here) (Data validation uses the
upper right hand desktop window.)
If not follow instructions in Setting crs monitor up in counting house
- Data validation jobs currently running on the CRS farm are labeled
DV######s###_DateYYYYMMDD_TimeHHMMSS_Set1.jf
In the lower window of the "CRS Farm Status for Phobos" window you
can look for data validation jobs, and check that one has started if you/or DAQ have
just sent real data to HPSS and have started datavalidation for that run and sequence.
- Login into phucsia as shift, you will need to enter the same shift password twice. (once
to log in, and once to enable you to be able to log into rcf without a password).
- Open a window, and open the DATA VALIDATION MONITOR (Green) window by typing:
<shift@phucsia:~> dvmonwin [ENTER]
- In the new window (green), login to rcf, by typing at the prompts:
<shift@phucsia:~> ssh phobreco@rsshgw.rhic.bnl.gov [ENTER]
- In the same window (green), now login to rcrsuser by typing at the prompts:
<rsshgw00:~ > ssh rcrsuser2 [ENTER]
- In the same window (green), start the monitoring program by typing at the prompt:
<phobreco@rcrsuser2 > tk_CRS_status.pl &[ENTER]
- This will pop-up a new window entitled "CRS Farm Status for Phobos", this
window allows monitoring of the jobs on CRS.
- Iconize the DATA VALIDATION MONITOR (Green) window.

The window is divided into two sections: The top for monitoring the specific nodes (i.e
computer, with dual processor). The bottom for monitoring each job currently running or
queued for the farm.
Note: This window does not automatically refresh itself, therefore to see the current
status hit the Refresh button.
Description of Top Window:
- Node: The name of the machines connected to the CRS farm
- Status: The current status of the node.
- Job Limit: The maximum number of jobs that can run of the node. As each
machine is a duel processor, it can run two jobs at once. The job limit is usually 3,
because for efficiency reasons, one job is staged sitting ready to go when either of the
processors is freed up.
- Running Jobs: This shows the number of jobs "running" on the
node. If 3, then 2 are processing and 1 is waiting.
Description of Bottom Window
- Subjob ID: Every job submitted to crs, is given a job id, this is it.
- Status: This is the current stage that the job is at. General jobs go
through the following stages
constructing->staging -> queuing -> transferring in ->running -> cleaning
mode
Constructing/Staging: Everything necessary to run the job, is
assembled
Queing: Waiting for a node to become available
Transferring in: All the files etc necessary to run the job,
are transferred onto the local disk/processor of the particular farm
computer.
Running: The job is currently running on that node
Cleaning node: The job is finished, and the files are
transferred to where they should go, and the node is cleaned so the next job
can run fresh.
- Node: The name of the node on which the job is running
- Job File: The name of the "job file" that was submitted to
the farm. The job file contains all the information that is used by the batch system to
construct the job on the crs node. For data validation it is a file that has the following
form
DV######s###_DateYYYYMMDD_TimeHHMMSS_Set1.jf
- Check data validation has been run on the run and sequence of interest (click here
to find out how)
- If necessary, start the Data Validation monitoring program in window
entitled "DATA VALIDATION CHECK" (blue window) (click here to find out how). If DVGui, present select
the run and sequence you want to validate. (click here to
find out)
- Examine the histograms, and at the end write the results to the database.
- To end the Data Validation monitoring program, go to the file menu and select
"Quit" option. (should not usually do)
- Check the error files for any errors or warnings, and note in the run logbook which ones
occur and how frequently.
- Goto the production
web page and enter the run range you want to look at.
- On this page, if you see that the first three boxes are green, for the run you are
interested in, then you can validate the run
- Login into phucsia as shift, you will need to enter the same shift password twice. (once
to log in, and once to enable you to be able to log into rcf without a password).
- Open a window then open the DATA VALIDATION CHECK (Blue) window, by typing :
<shift@phucsia:~> dvcheckwin [ENTER]
- In the new window (blue), login to rcf, by typing at the prompts:
<shift@phucsia:~> ssh phobreco@rsshgw.rhic.bnl.gov [ENTER]
- In the same window (blue), now login to phobint10 by typing at the prompts:
<rsshgw00:~
> ssh rcas4010 [ENTER]
- In the window "Data Validation Check" (Blue) on phuscia, look for the prompt
"phobreco@rcas4010:~>". If don't see
it refer to "Setting
Up DV output checking in CH" to get it working.
- At prompt, type
cd [ENTER]
- At prompt, type
phat start_dv.C [ENTER]
(This will start the dv gui after doing some checks. If fails checks follow instructions
given)
- In the new window entitled "Phobos Data Validation Monitoring", go to the
"Select" Menu, chose "Run and Sequence"
(If cant find this window on phucsia, goto here)
- In the new window entitled "Selection" enter the run number you want to
validate (by default, if you don't choose a sequence, all are shown), and then hit the
"Submit" button.
- In the main window you will now see the list of sequence files that correspond to this
run number. Check the "select all" option, so that the sequences are
highlighted, and hit the "Validate" button. (ignore the Bad window errors in
blue window)
- Wait for a few minutes while the validation is being processed.
- Once you see several tabs with plots corresponding to the subsystems, go through them
and click what appears to be the appropriate choice, "Validate",
"Reject", or "No Decision". For some of the systems, by clicking
"compare to references", a window showing what the "normal" plot is is
provided, or guiding lines in the graphs.
- Use the "Complain" menu on the top right to send comments to the authors.
- Go to the phobos portal.
- Click on Complete Run Logbook and select the run range of interest.
- Click on the "open book icon" , under heading "Comments" and enter
your comment for the appropriate run number
- Don't forget to reference the sequence number, with your comment.
- cd $DV_OUT/pr01/err and $DV_OUT/pr01/log
- File names have the run and sequence number in them i.e:
DateZZZZZ_TimeXXXX_Set1_[Run Number]s[Seq Number].err
DateZZZZZ_TimeXXXX_Set1_[Run Number]s[Seq Number].log
- cd $DV_OUT/pr01/err
- At prompt type,
./error.pl [Runnumber] [SequenceNumber] [ENTER]
(e.g: ./error.pl 3456 0 [ENTER])
- Displayed will be the error and warning messages, as well as the number of times
they appear in the error file.
Go to "How to start the Data
Validation Gui".
- Goto the DAQ X-term
- Goto a window entitled "Sinking Window", if can't find it open the window (for
instructions go here)
- Goto the directory where the data is located, via typing
> cd /data/X [ENTER] (where X= the data disk
number, found from looking at comment in run log book)
- To sink a data file type
> ~phobsink/bin/write_and_recon <filename> [ENTER]
(This will output a lot of stuff to the screen, then leave you with a prompt, then you can
submit your next file)
- Wait ~4 minutes and look at the window on phucsia entitled "CRS status for
PHOBOS" (if windows not there goto Setting crs monitor up in counting house)
Hit the "refresh" button on each screen.
You should see (use scroll bar) the filename DV[RUNNumber]s[SeqNumber]_Date........
If you don't then file did not sink, call expert.
- Open a window on the DAQ X-term
- In this window ,type
> ssh phobos@phobosx.phobos.bnl.gov
[ENTER]
...
phobos@phobosx.phobos.bnl.gov: > {ENTER phobos password}
.....
passphrase> {ENTER the passphrase for phobos}
(Note: Password and passphrase on DAQ monitor)
- You are now logged into phobos@phobosx. Type the
following to open the "Sinking Window"
> dtterm -name "Sinking Window" [ENTER]
- If asked in the "Sinking Window", for a pass phrase, enter the phassphrase for
phobos
- You can now iconize, the original window, and you now have a sinking window. Type
> cd /data [ENTER]
HPSS Health and Status Page
This status page tells you what is the current status of HPSS. If it is all green, then
HPSS, appears to be ok.
- Goto phucsia, find the Screen entitled "HPSS Health and Status" (If does not
exist, goto "Setting Up HPSS Monitor Screen")

- For a detailed description, of the above status page goto the documentation
page.
- To quit, Goto Menu "Session", and choose "Quit Sammi", and
"Confirm Quit"
To see if HPSS is really working,
- Login to on RCF interactive node as yourself(i.e. ssh rsshgw.rhic.bnl.gov, and then ssh
phobint00)
- Type, at prompt,
~> rftp [ENTER]
- If the responce is like
Connected to rmds01.rcf.bnl.gov
220 rmds01 FTP server (.....) ready
331 Password require for <Username>
230 <Username> logged in
200 COS set to 16.
Remote system type UNIX
Using binary mode to transfer files
Multinode is Disabled
ftp>
Then HPSS is up. Otherwise HPSS is down with a problem.
- Open a window on phucsia
- In this window type
ssh PHBS_op [ENTER]
- At prompt, PHBS_op@hpss.rcf.bnl.gov's
password:, enter the HPSS Monitor password (on phucsia)
- At prompt, Enter SAMMI User Name [PHBS_op]:, hit [ENTER]
- At prompt, Enter SAM2_DISPLAY variable [rmds01:21.0]:, hit
[ENTER]
- You should see "Starting SAMMI session for user 'PHBS_op' ..." + other Staring
type info, and then a login box, entitled "SSM Login" will appear. In this box,
for User ID, enter PHBS_op, and the same Password as above.
- The "HPSS Health and Status " page will now appear.
How to monitor MDC sinking and reconstruction
There are two things to check are working, 1) sinking and 2)reconstruction (see above
documentation)
How to check sinking is working ok
- On the DAQ computer, in window 4, there should be a window entitled "Sinking
Window". If not following instructions
on how to set it up.
- In this window you should see, Lines like
"Writing PhoRaw000021s027.root to HPSS"
and "Successfully submitted pass0 job for file PhoRaw000021s026.root"
+ other info, scrolling by at a rate of about 1 file per 2 minutes. If this is true then
you are sinking ok.
- Also you can check the following page,
http://ru10.rhic.bnl.gov/alarms/daq.html
This shows the rate at which we are sinking.
- If this is not happening, and nothing is begin sunk, then you should first see if HPSS
is functional, see here
- If HPSS is functional, do a CRTK-C in the sinking window, and start it again. If then
does not work, report error to RCF.
- If not functional , report problem to RCF
- When they say ready to go restart sinking.
- Goto the RCF web page. http://www.rhic.bnl.gov/RCF
- Follow the link, to Page-on-call RCF
Staff
This page will tell you the phone number to call (pager does not currently work) to get
person on shift.
- If you don't get a responce, goto to the link from the RCF web page called RCF
Monitoring, and follow link to RCF shift Schedule
. Find the person on shift there and call their extension number, and leave a message
and write them an email if you don't get hold of them.(RCF Emails Here)
- If after reasonable time don't get any responce, call Tom Throwe.
- Always submit a trouble ticket explaining the situation.
How do I know when to validate a run?
There is a window on phucsia, entitled "Runs to be
Validated".
If there are runs to validate, the window will look like:
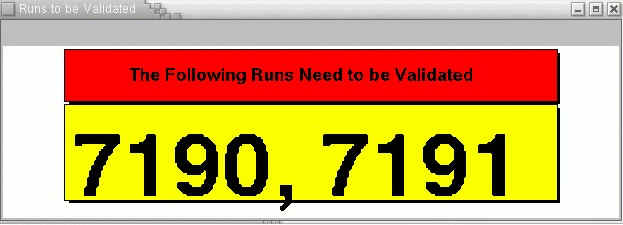
If you see this, you should then validate the runs shown.
If there are no runs to validate, then the window will look like:
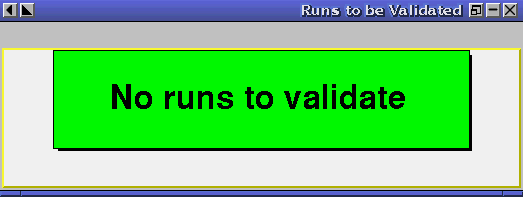
How do I detect problems in the processing?
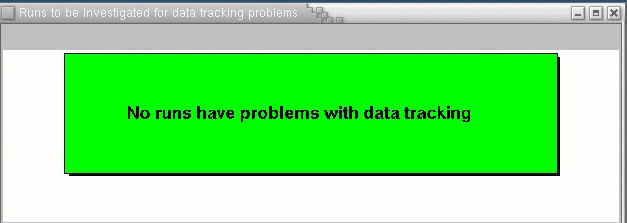
There is a window on phucsia, entitled "Runs to be Investigated for data tracking
problems".
If there is a problem, the window will look like:
(Need snap shot of window)
If you see this window, then for each run, goto the
If there are no gross problems in the data processing, you should see a window like:
Please send all comments and suggestions
regarding this page to Nigel
|