Last Updated onWednesday, January 19, 2005at22:27:31. by Author: Andrei Sukhanov
(Expert)
DAQ, General Information/Help. 1
Instructions for running DAQ using the GUI 1
What to check for while running. 5
Recovering from Silicon Latchup. 5
Known Errors and modes of failure: 6
How to run DAQ in console command line mode. 7
Known Problems/Errors in Event Building. 11
How to find out that VME ADC is working properly. 12
How to Reset Latchup in a VME ADC.. 13
How to Reset Silicon Latchup. 13
How to reboot usp.phobos.bnl.gov. 13
How to run without VME (only Silicon and Fastbus) 13
Starting the Micro DAQ when system is set to run normal DAQ.. 14
Please send all comments and suggestions regarding this page to Andrei 14
01/04/2003: First draft of DAQ documentation for PR03, only console mode DAQ control for now.
01/13/2003: Added directions to reset Latchup in VME and silicon. Also, not required to veto triggers before starting a run, so updated the START_RUN section.
01/23/2003: Added GUI documentation.
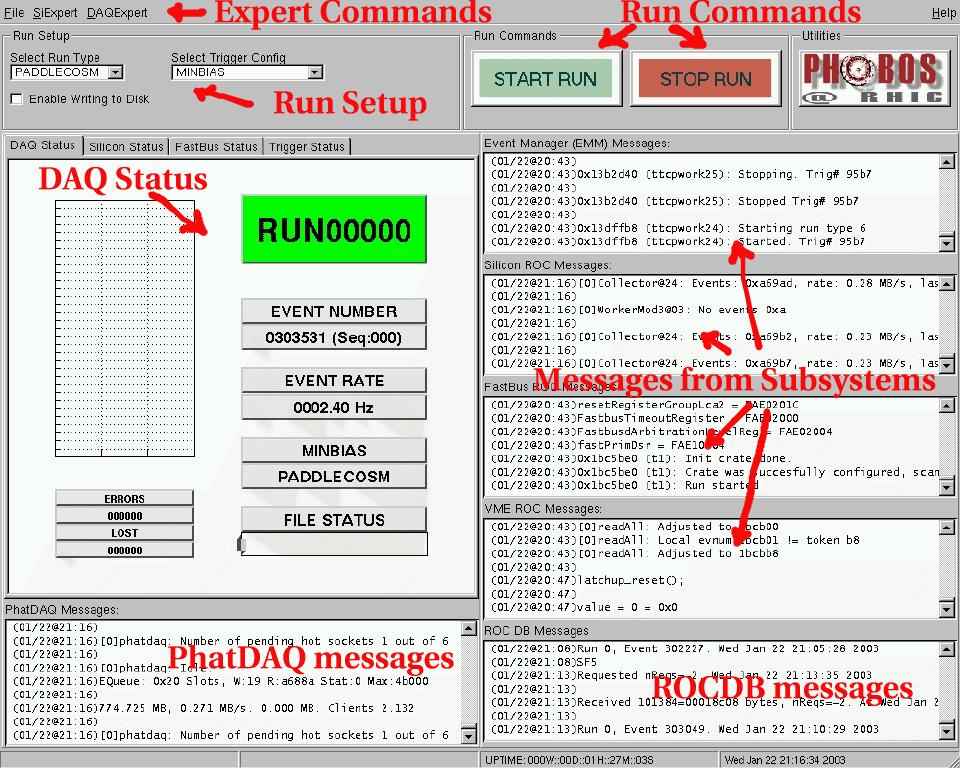
Since a picture is worth a thousand words, here's an annotated screendump showing different parts of the GUI. The big red labels describe the approximate functions of different sections of the GUI.
Most control operations are carried out from the top left 2 panels, for example:
Setting up a Run type
Starting / Stopping Runs
If not already logged in, Login to the DAQ X-Term computer in the center of console with USER='runctrl', PASSWD='10oclock'
You should see an icon titled 'PhatDAQRunCtrl' in the center of your desktop (desktop ONE).
Double-Click on this icon to launch the GUI. Hit 'OK' on the options dialog that appears, and you should see a 'Run' window start up.
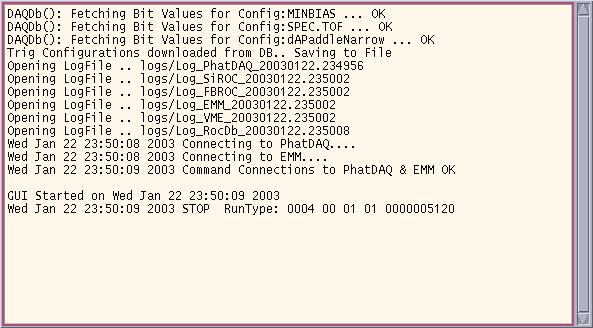
In particular, the six logfiles for the various subsystems should be opened automatically, and the two command connections to PhatDAQ and EMM should be initiated. If the messages stop at any point in the above 'Run' window, this usually indicates that particular subsystem is busy/refusing connection; you should call the DAQ expert on call in this case, and let him/her know the contents of the above window.
If all the connections noted in the 'Run' window are made successfully, the PhatDAQRunControl GUI window should start up.
All the SubSystem windows should update with various messages (the details of these messages are not important for the end-user). All initializations are performed automatically over a period of about 30 sec, and the various messages indicate these initializations are in progress.
System readiness to take data is indicated by the following message in the 'Silicon
ROC Messages' window: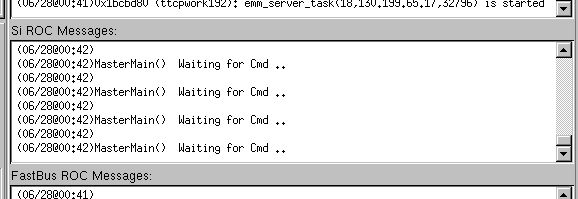
Guide to selecting Run Types:
Run Type |
Detector Setup |
Special considerations (See details below) |
ALLBEAM |
Silicon + Plastic (Normal data taking) |
Si BUSY should be removed for first running after Silicon is switched ON. |
PADDLECOSM |
Plastic Only, NO Silicon (Beam studies with Silicon turned OFF) |
None. |
SICOSM |
PCAL Cosmic running, (Silicon OFF, Don't care about Plastics) |
PCAL HV should set
appropriately, |
FBTIME/FBPED |
FastBus Time Calibrator and FastBus Pedestal runs |
Start with Master VETO set, then disable VETO to get high rate. |
Considerations for Each RunType:
ALLBEAM:
In general, you should STOP RUN before performing any operation with EITHER Silicon Low
Voltage or High Voltage. You can START RUN immediately after the operation, but it is
important for DAQ stability that you don't have a RUN going while you are ramping
either Low Voltage or High Voltage.
After Silicon Low Voltage is first switched ON, and you are ready to start running,
you need to temporarily disable the Silicon Busy signal. This is done by going into the
Electronics Room and unplugging a cable marked as 'Silicon BUSY' located in the bottom
left trigger rack. You can then hit START RUN, ensure that you are getting events, and go
back in to the electronics room and plug the Silicon BUSY back in again. Note that this
procedure needs to be followed only ONCE, after you first switch on Silicon Low Voltage,
and you must remember to plug back in the Silicon BUSY after starting the RUN.
PADDLECOSM:
No special considerations.
SICOSM: To
switch to PCAL cosmic running when there is no beam in the machine, you need to load
different High Voltage settings into the PCAL (consult PCAL documentation for this). Don't
forget to switch back to normal high voltage settings after you are done with the PCAL
cosmic running.
After following the above considerations, you can hit the large friendly green button labelled 'START RUN' to start the run. A beep indicates run has started, and the DAQ Status window should start updating with the current RUN in green, the event rate etc. The Run number is 0 if you are not writing to disk.
Contrary to popular belief, this is not the time to open your laptop and check your email! Proceed to see the section on 'What to check for while running', to see what are the things to monitor while DAQ is running and writing data to disk.
Stopping a Run is as simple as hitting the large friendly red button labelled 'STOP RUN'. Wait ~ 5 seconds after stopping a Run to let all the sub-systems return back to steady state before attempting to start a new run. Final system readiness is indicated by the same message 'Waiting for CMD....' in the SiliconROC messages window.
Check for Green status and increasing event counter in the GUI. The Event Rate indicator should be up at ~ 230 Hz (the maximum rate accepted by the DAQ in case of good beam conditions).
If running ALLBEAM type with Writing to DISK enabled, you should hear a beep everytime the sequence switches.
You should also monitor the bottom two scalers on the visual scaler display which monitor the input/output Level-0 triggers to the DAQ. Both should be up at ~230 Hz commensurate with what is reported in the DAQ status pane.
If silicon is ON, you also need to keep close, continuous watch on the radiation levels reported by RadMon (chipmunk display). Consult Silicon documentation for details on monitoring Silicon health.
When the central alarmer alarms that Latchup has occured, acknowledge the alarm and STOP RUN.
Start a new run without writing so that you keep getting updated data from the Silicon FEC's.
Click on the 'Si-Expert' -> 'Restart ROCDB' menu item to restart RocDB and get a fresh reading from ROCdB containing the latest Silicon slow monitoring values. RocDB takes about a minute to put in a new reading into the database.
Go to the 'Si Latchup VFP Summary' link on the PHOBOS portal to determine which FEC ports have latched up. If there are too many (greater than 8 ports), consult Silicon expert for further instructions - donot reset latchup if there are too many ports latched up as this could trip the Low Voltage power supplies. Consult Silicon Expert in the case of large number of latchups due to adverse beam conditions.
If less than 8 ports are latched up, Click on 'Si-Expert'->'Reset Si Latchup' to reset the latchup.
Click on the 'Si-Expert' -> 'Restart ROCDB' menu item to restart RocDB again and get the latest Silicon slow monitoring values.
Go back to the portal page to ensure that the latched up ports have recovered.
DAQExpert/Close VME ROC Connection
Push RST button on the leftmost module in VME crate F.
Wait 2’39” or until green light the rightmost module is on and red is off.
You have multiple instances of phatdaq running and need to reboot usp.phobos.bnl.gov:
1. Locate USP window on PhAndrei workstation. (icon USP in left quarter of the taskbar at the bottom of the screen)
2. Login as root (password is in the drawer)
3. #reboot
4. wait until ‘The system is ready’
Indication:
1. No response to stop run command in ‘Fastbus ROC Messages’.
2. Red light L2 on Fastbus crate, module STR340/SFI
Workaround:
1. Stop run
2. Reboot Fastbus by pressing RST button on module STR340/SFI. It will take 3
minutes.
3. Wait for red light L4 on STR340/SFI.
4. DAQExpert/Close Fastbus
5. DAQExpert/Open Fastbus
6. Start run
This is probably due to network problems on usp.phobos.bnl.gov.
Indication:
Open terminal window and execute command:
>ping usp
Repeat pinging until it start responding. It usually takes 1-2 minutes. If more than 5 minutes – call Andrei.
Usually it should continue taking data by itself.
ALL control operations are done on the DAQ X-Term console (left-center) on the PHOBOS main console. You may occasionally need to go over to the PHOBOSNT computer monitor (on Andrei's desk) to check on the status of a few subsystems.
ALL passwords for logging in to various consoles mentioned below are 10oclock
If you are not already logged in on the DAQ X-Term, login with username 'runctrl'
You should see an icon on the DAQ xterm desktop called 'StartDAQ_CommandLine', double-click on it and say 'OK' to whatever dialog box appears. A window called 'Run' will appear, that you can close by double-clicking on its top left corner (we won't be using it)
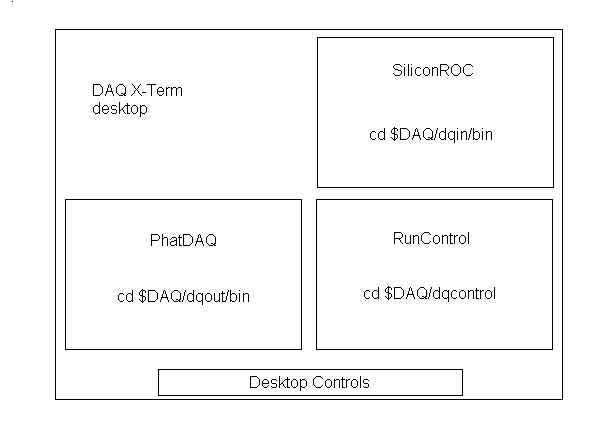
You should now see three windows starting on the desktop, each requiring you to enter the same password. The three windows should have titles 'SiliconROC', 'RunControl' and 'PhatDAQ'. .
In Window Named |
Type in |
SiliconROC |
source startROC.csh |
PhatDAQ |
source start.csh |
RunControl |
source start.csh |
* *
* W E L C O M E to R O O T *
* *
* Version 2.23/12 1 February 2000 *
* *
* You are welcome to visit our Web site *
* http://root.cern.ch *
* *
*******************************************
CINT/ROOT C/C++ Interpreter version 5.14.25, Nov 25 1999
Type ? for help. Commands must be C++ statements.
Enclose multiple statements between { }.
root [0]
Processing runcontrol.C...
Note: posix.dll is not found. Do 'sh setup' in $CINTSYSDIR/lib/posix directory if you use UNIX.
phatdaq control session
Cannot connect to eb port 7001. Start phatdaq first!
Connecting to 130.199.65.20 ...Done
started.
Use rc_command.C(command,argument) to control phatdaq.
root [1]
MasterCE Waiting for START_RUN.....
Master Waiting for command....
You should check with the on-call trigger expert at this point to ensure that the trigger settings are as desired, mainly to ensure that the data you are taking is not crap. During detector commissioning phase, the trigger settings are under study, and you will have to co-ordinate with the trigger expert who may direct you to take different data sets with different trigger settings.
If silicon
system has been turned on (Low Voltage and High Voltage) you can now start a run by typing
in at the 'RunControl' window: (in the ROOT prompt)
root [2] rc_start(RUN_ALLBEAM+WRITING)
For running
without the Silicon detectors for trigger studies, you need to check with the trigger
expert on call that the trigger settings are as desired, and type in at the RunControl
window:
root [2] rc_start(RUN_PADDLECOSM+WRITING)
For PCAL cosmic running, you need
to check with the PCAL expert on call that the PCAL HV settings are as desired, and type
in at the RunControl window:
root [2] rc_start(RUN_SICOSM+WRITING)
Also, the time calibrator must be switched off in hardware while
running PCAL cosmic.
This should cause triggers to start getting through to the DAQ, indicated for example by yellow and green lights flashing on top of the FastBus crate, located to the left of the trigger rack.
You can also check the run status periodically by typing 'rc_status()' command on the commandline. The online displays should also update continuously with new data, new run and new event numbers.
root [3] rc_stop_run()
When Silicon is on:
root [2] rc_start(RUN_ALLBEAM+WRITING)
When Silicon is off:
root [2] rc_start(RUN_PADDLECOSM+WRITING)
You can stop
the run by typing in at the 'RunControl' window: (in the ROOT prompt)
root [3] rc_stop_run()
root [5] .q
Next, you must hit Ctrl-C once in the SiliconROC window. This should cause the SiliconROC program to stop.
You now need to
launch a small sub-program in the SiliconROC to clean up all stale DAQ threads. You do
this by typing in the SiliconROC window.
source cleanup.csh
When this cleanup program starts up, the PhatDAQ process in the 'PhatDAQ' window should
exit cleanly, saying 'Pollable event occured' and return to the command prompt.
Once the cleanup is finished, the SiliconROC window shows messages like 'Other party is no longer connected...'. At this point you should also kill the cleanup program by pressing Ctrl-C once in the SiliconROC window.
Warnings (that can be ignored)
PhatDAQ reports occassionally '***Break**** write on a pipe' type messages. These are harmless (online distributor reconnecting) and can be ignored.
Errors (that should NOT be ignored)
Occasionally,
the PhatDAQ program will exit with an error message like:
fpdp_event_wait: Error in fpdp_event_wait, Data Stamp
DEADFACE != B0EF0805
fpdp_event_wait: Trying to adjust..
This indicates that PhatDAQ has crashed with an unrecoverable error. In this case, you
only need to restart PhatDAQ itself, without restarting the SiliconROC. The procedure is:
1) Stop the current run: (in the RunControl window) type: root [2] rc_stop_run
2) Quit from RunControl: (in the RunControl window) type: root [2] .q
3) Restart PhatDAQ: (in the PhatDAQ window) type: source
start.csh
4) Restart RunControl: (in the RunControl window) type: source
start.csh
During data taking with collisions, the lights on top of the Fastbus crate in the electronics room (visible from the console) should remain continuously lit - they are actually flashing at a high rate indicating data taking is in progress. The online software should continuously update with increasing event numbers. If there are no collisions and you are taking cosmic data, you should see at least heartbeat triggers flashing at 1Hz or so. If this is not the case, check DAQ status by typing 'rc_status()' command in the 'RunControl' window. Consult DAQ expert on call to debug further.
If Si Hybrids reading on PHOBOS portal gets old for 10 min, but DAQ is taking data and silicon is ON it is probable that the rocdb program, that pulls monitoring information from DAQ and writes it to database has crashed.
To restart this program, do the following:
Locate ROCDB window on DAQ X-Term
(or open new x-terminal by clcking on the 'terminal' icon in the desktop controls.
ssh phobos@usp.phobos.bnl.gov
<passwd will be required>
cd $DAQ/dqout/bin)
Kill currently running rocdb using Ctrl C.
If it does not respond then use following command in RunControl window:
.!kill_rocdb
And enter the command:
rocdb 1 0 30
Here the first argument enables connection to the database, second argument enables
writing to the file rocdblogMMDD.csv
The program detects if phatdaq is running, in this case it requests the whole event from
the phatdaq, extracts monitoring information from the FEC trailer blocks and sends it to
the datadase.
To change reporting interval to 60 seconds:
rocdb 1 0 60
2. telnet 130.199.65.18
Trying 130.199.65.18...
Connected to 130.199.65.18.
Escape character is '^]'.
3. vmeroc >ds_po=0x100.
You will see something like:
[0]readV792.2@fa060000: [60]Status1,2=0043,28,EvCnt=000a77
0000:4a002000 4800406c 4810408d 48014078 48114086 4802406d 4812405c 4803407c 0020:48134079
48044086 4814407f 4805407b 48154085 4806407e 4816407d 48074089 0040:4817409e 48084088
48184098 48094082 48194086 480a407f 481a4072 480b409b 0060:481b4061 480c4096 481c408b
480d409d 481d4084 480e4077 481e4078 480f4085 0080:481f4031 4e000a77
V792.2 – correspond to ADC2.
First word 4a002000– header
Last word 4e000a77 – footer
The rest are codes. For example 48 in each word means slot 9. The lower 13 bits are values.
In the above example we see normal pedestals.
4. When you
finished, set the printout mode back to normal:
vmeroc >ds_po=0
NOTE: This documentation is somewhat obsolete. Andrei will update it.
For now, ignore steps 1&2 and go right to 3. It is also occasionally necessary to cycle the VME power (red button buried under cables on the right side of the power supply which is right below the crate). Note item 5 below also applies if you recycle the power.
1. Locate the troubled ADC, it will have red OVC PWR.
2. Using ‘ADC LATCHUP RESET TOOL’ push a miniature push-button switch PWR (between two cable connectors). You should do it twice until OVC PWR turns green.
3. Reboot the crate by pressing RST button on the leftmost module. Observe that on the rightmost module (AVME 941X) turned red FAIL.
4. In DAQ GUI / DAQEsxpert select Close VME ROC Connection.
5. Wait at least 2 minutes 29 seconds after the pressing RST until the red light FAIL is off and green light PASS is on (both are on the rightmost module in the crate: AVME 941X)
6. In DAQ GUI / DAQEsxpert select Open VME ROC Connection.
7. Stop the run and watch that VME ROC Messages is responding.
If, after starting a run, you see in VME ROC messages: “Bad VME interrupt 0” that means that rebooting was not successful and you need to reboot the crate by pressing ‘RST’ button on the leftmost module. Go to 3.
Locate VMEROC window at DAQ X-Term computer and enter the command:
type in the command: (or use Esc+k to bring back recently typed command)
latchup_reset();
Use ‘phatdaq 3’ instead of ‘phatdaq’
Micro DAQ runs on the PHOBOS VME crate. It waits for the gate on the first ADC, reads all modules and sends event to the usp.phobos.bnl.gov using UDP protocol. The reader program udq running on usp receives the events and write them to the file usp.phobos.bnl.gov:/data/0/udq_yymmdd_hhmmss.udq.
ssh phobos@usp.phobos.bnl.gov
cd /data/0/udqdata
udq 0 60
The first argument controls event printing; if it is 1 then
program will print every event. The second argument is the file-change period in minutes.
The program will respond with:
udq - Micro DAQ spooler. Printout=0, File change every 60 min
file udq_031120_165647.udq opened
data socket opened at port 7500 size 30720
lEv:5,rEv:1650,d:0,kB:2,ev/s:0
lEv:16,rEv:1661,d:0,kB:7,ev/s:1
…
If it does not respond with incrementing events then probably the server program is not running on vmeroc.phobos.bnl.gov. The simplest way to start it – recycle the power on the vme crate. 5 minutes after recycling the udq should report incoming events.
When you finished with uDAQ, recycle the power on the crate to have it back for normal DAQ.
Please send all comments and suggestions regarding this page to Andrei |
level2 lfo23; tab-stops:list 1.0in'>3.
#reboot
4.
wait until ‘The system is
ready’
Indication:
1. No response to stop run command in
‘Fastbus ROC Messages’.
2. Red light L2 on Fastbus crate, module
STR340/SFI
Workaround:
1. Stop run
2. Reboot Fastbus by pressing RST button on
module STR340/SFI. It will take 3 minutes.
3. Wait for red light L4 on STR340/SFI.
4. DAQExpert/Close Fastbus
5. DAQExpert/Open Fastbus
6. Start run
This is probably due to network problems on usp.phobos.bnl.gov.
Indication:
Open terminal window and execute command:
>ping usp
Repeat pinging until it start responding. It usually takes 1-2 minutes. If more than 5 minutes – call Andrei.
Usually it should continue taking data by itself.
In Window Named |
Type in |
SiliconROC |
source startROC.csh |
PhatDAQ |
source start.csh |
RunControl |
source start.csh |
*
*
*
W E L C O M E to R O O T
*
*
*
* Version 2.23/12
1 February 2000 *
*
*
* You
are welcome to visit our Web site *
*
http://root.cern.ch
*
*
*
*******************************************
CINT/ROOT C/C++ Interpreter
version 5.14.25, Nov 25 1999
Type ? for help. Commands
must be C++ statements.
Enclose multiple statements
between { }.
root [0]
Processing runcontrol.C...
Note: posix.dll is not found.
Do 'sh setup' in $CINTSYSDIR/lib/posix directory if you use UNIX.
phatdaq control session
Cannot connect to eb port
7001. Start phatdaq first!
Connecting to 130.199.65.20
...Done
started.
Use
rc_command.C(command,argument) to control phatdaq.
root [1]
MasterCE Waiting for
START_RUN.....
Master Waiting for command....
root
[3] rc_stop_run()
When Silicon is on:
root
[2] rc_start(RUN_ALLBEAM+WRITING)
When Silicon is off:
root
[2] rc_start(RUN_PADDLECOSM+WRITING)
Warnings (that can be ignored)
Errors (that should NOT be ignored)
If Si Hybrids reading on PHOBOS portal
gets old for 10 min, but DAQ is taking data and silicon is ON it is probable that the
rocdb program, that pulls monitoring information from DAQ and writes it to database has
crashed.
To restart this program, do the
following:
Locate ROCDB window on DAQ X-Term
(or open new x-terminal by clcking on the 'terminal' icon in the desktop controls.
ssh phobos@usp.phobos.bnl.gov
<passwd will be required>
cd $DAQ/dqout/bin)
Kill currently running rocdb using Ctrl
C. If it does not respond then use following command in RunControl window:
.!kill_rocdb
And enter the command:
rocdb 1 0 30
Here the first argument enables connection to the database, second argument enables
writing to the file rocdblogMMDD.csv
The program detects if phatdaq is running, in this case it requests the whole event from
the phatdaq, extracts monitoring information from the FEC trailer blocks and sends it to
the datadase.
To change reporting interval to 60
seconds:
rocdb 1 0 60
2. telnet 130.199.65.18
Trying 130.199.65.18...
Connected to 130.199.65.18.
Escape character is '^]'.
3. vmeroc >ds_po=0x100.
You will see something like:
[0]readV792.2@fa060000: [60]Status1,2=0043,28,EvCnt=000a77
0000:4a002000 4800406c 4810408d 48014078 48114086 4802406d 4812405c 4803407c 0020:48134079
48044086 4814407f 4805407b 48154085 4806407e 4816407d 48074089 0040:4817409e 48084088
48184098 48094082 48194086 480a407f 481a4072 480b409b 0060:481b4061 480c4096 481c408b
480d409d 481d4084 480e4077 481e4078 480f4085 0080:481f4031 4e000a77
V792.2 – correspond to ADC2.
First word 4a002000– header
Last word 4e000a77 – footer
The rest are codes. For example 48 in each word means slot 9. The lower 13 bits are values.
In the above example we see normal pedestals.
4. When you finished, set the printout mode back to
normal:
vmeroc >ds_po=0
1. Locate the troubled ADC, it will have red OVC PWR.
2. Using ‘ADC LATCHUP RESET TOOL’ push a miniature push-button switch PWR (between two cable connectors). You should do
it twice until OVC PWR turns green.
3. Reboot the crate by pressing RST button on the leftmost module. Observe that on
the rightmost module (AVME 941X) turned red FAIL.
4. In DAQ GUI / DAQEsxpert select Close VME ROC Connection.
5. Wait at least 2 minutes 29 seconds after the
pressing RST until the red light FAIL is off and green light PASS is on (both are on the rightmost module in the
crate: AVME 941X)
6. In DAQ GUI / DAQEsxpert select Open VME ROC Connection.
7. Stop the run and watch that VME ROC Messages is responding.
If, after
starting a run, you see in VME ROC messages: “Bad VME interrupt 0” that means that rebooting was not
successful and you need to reboot the crate by pressing ‘RST’ button on the
leftmost module. Go to 3.
latchup_reset();
Use ‘phatdaq 3’ instead of
‘phatdaq’
Micro DAQ runs on the PHOBOS VME crate.
It waits for the gate on the first ADC, reads all modules and sends event to the
usp.phobos.bnl.gov using UDP protocol. The reader program udq running on usp receives the
events and write them to the file usp.phobos.bnl.gov:/data/0/udq_yymmdd_hhmmss.udq.
ssh phobos@usp.phobos.bnl.gov
cd /data/0
udq 0 60
The first argument controls event
printing; if it is 1 then program will print every event. The second argument is the
file-change period in minutes.
The program will respond with:
udq -
Micro DAQ spooler. Printout=0, File change every 60 min
file
udq_031120_165647.udq opened
data
socket opened at port 7500 size 30720
lEv:5,rEv:1650,d:0,kB:2,ev/s:0
lEv:16,rEv:1661,d:0,kB:7,ev/s:1
…
If it does not respond with incrementing
events then probably the server program is not running on vmeroc.phobos.bnl.gov. The
simplest way to start it – recycle the power on the vme crate. 5 minutes after
recycling the udq should report incoming events.
When you finished with
uDAQ, recycle the power on the crate to have it back for normal DAQ.
Please send all comments and suggestions regarding this
page to Andrei
|