Date: Thu Jan 22 2004 - 15:54:58 EST
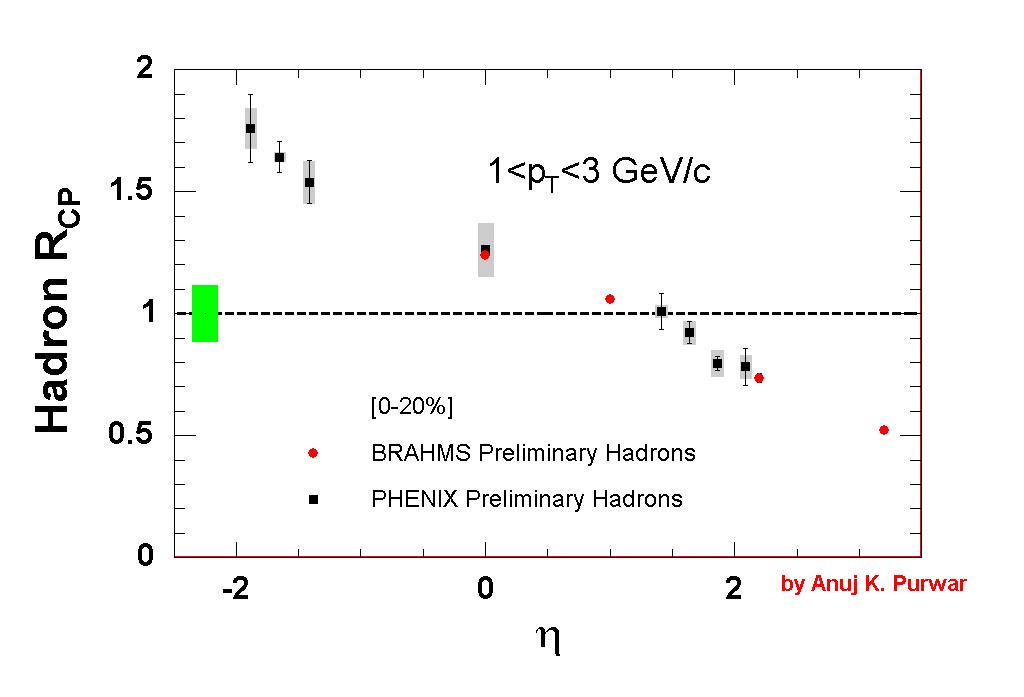
Here are two figures we prepared at the end of the conference but the
rapporteur didn't show.
They are both very interesting. From our side I fitted the Rcp to  a
constant to get the average value from 1 to 3 GeV/c (as PHENIX )

Ramiro

Begin forwarded message:

> From: "Anuj K. Purwar" <purwar@rcf.rhic.bnl.gov>
> Date: January 16, 2004 6:13:38 PM EST
> To: "'Kirill Filimonov'" <KVFilimonov@lbl.gov>, <xzb@bnl.gov>, "Ralf
> Averbeck" <ralf@skipper.physics.sunysb.edu>
> Cc: <debbe@bnl.gov>, "'Thomas K Hemmick'"
> <hemmick@skipper.physics.sunysb.edu>
> Subject: BRAHMS/PHENIX Combined Rcp plot
> Reply-To: <purwar@rcf.rhic.bnl.gov>
>
> Dear Xangbu,
>
> 	The PHOBOS Data is R_dAu for Min.Bias, as compared to Rcp in 0-20%
> centrality range for BRAHMS and PHENIX, so it might not be correct to
> show
> it superimposed. I am attaching two plots:
>
> 1) The combined hadron Rcp plot for BRAHMS and PHENIX:
> brahms_phenix_rcp1.gif
>
> 2) The combined hadron Rcp plot for BRAHMS and PHENIX, with PHENIX
> J/Psi Rcp
> added: brahms_phenix_rcpJPsi.gif
>
>
> 	Could you let me know which of these plots you plan to show?
>
> Regards,
> Anuj
>
> Anuj K. Purwar
> Relativistic Heavy Ion Physics Group,
> Department of Physics & Astronomy,
> State University of New York, at Stony Brook,
> Stony Brook, NY 11794.
>
>


_______________________________________________
Brahms-l mailing list
Brahms-l@lists.bnl.gov
http://lists.bnl.gov/mailman/listinfo/brahms-l