Date: Thu, 14 Jun 2007 15:41:05 +0200
Hi,

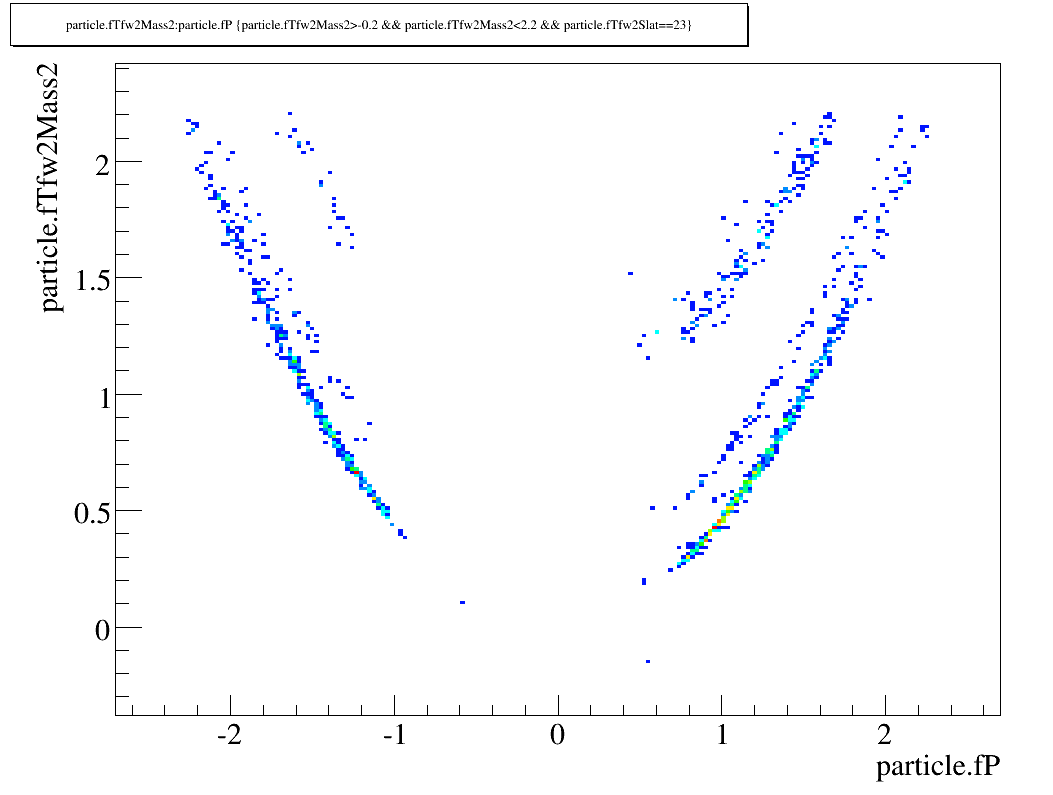
does anybody know which part of tof calibration that can make a m2 vs p
distribution look like the one in attached file. In this setting I have
some slats with normal distribution, and some slats that give results as
the attached gif. This rules out any mistake in the slewing I think, as
that is only done once. I cannot see big/significant difference in
numbers commited to the calib DB between good and bad slats...

All help and ideas appreciated!

Cheers,
	Truls

_______________________________________________
Brahms-dev-l mailing list
Brahms-dev-l_at_lists.bnl.gov
https://lists.bnl.gov/mailman/listinfo/brahms-dev-l
