Date: Thu Jul 29 2004 - 13:45:23 EDT
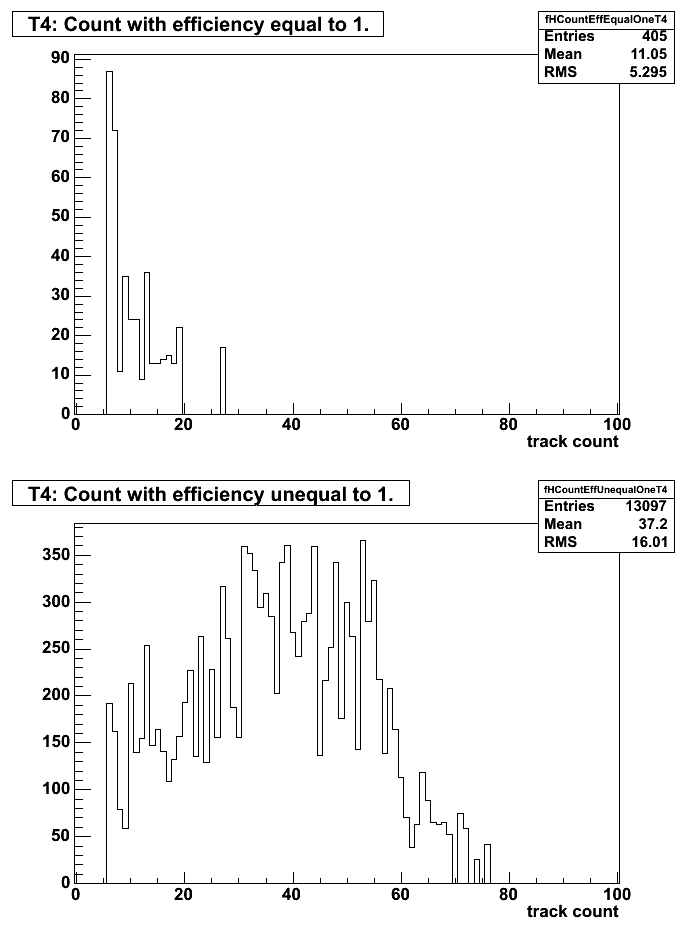
Howdy Peter. Peter H.L. Christiansen wrote: > One things that I tried to do at some point was to check the extrapolated > yield of unidentified charged particles calculated with FFS and FS to the > published values. In principle this allows you to partly verify if the > combination of efficiency, decays corrections etc. is correct.... There > must be a power point from some colaboration meeting end of last year on > the BRAHMS homepage. I found that FFS was ok, but FS was generally too > low, but I think it was a premature conclusion in the sense that I should > use more time on this. I think it is a good idea to do make these kind of > checks, but probably you need a long time to really understand the > details. To sit down and really understand the FS is still a major task > for someone;) > > BTW it is also good to check that you have the latest greatest set of > efficiencies from Pawel and remember that they are in principle related to > a special set of reduced files with the tracking, geometry and magnetic > fields as of that date. Pawel? Could you point me to your latest results, please? > The bottomline is ofcourse that it is hard to say something _quick_ about > the correctness of the efficiencies....... If however you want to trace > the values of 100% you could start by studying the projection of the 3d > efficiencies and I believe there is also a 3D count histogram. That way > you might be able to identify the problems in a reasonably fast way. For > me it is clear that with Pawels method you will have efficiencies that > will be 0 and 1 because of the counting statistics and maybe also because > of geometry/fields. This leads to the MC efficiency estimates ala Truls > which is a tough way to go...... I also assume efficiency of 0 and 1 are possible outcomes. In fact, plotting the count from the 3D count histogram (i.e. the ones whose names end with "_ref") resulting in efficiency = 1 shows smaller number of counts relative to the ones leading to efficiency != 1. See the attached plot. It looks like efficiency of 1 typically corresponds to low count, which I suppose one may expect. Thus certain bins may correctly have efficiency = 1. But it could also be that the low count is deemed insufficient for determining efficiency and therefore it may be set to a default value of 1 and filled in the histogram. Especially the fact that this bin in the distribution is populated discontinuously from the lower values I find worrisome. It appears to me that the default value for the efficiency is 1. Is this true, Pawel? Is the code used for generating the 3D reference track efficiency histograms located in some brahms_app directory? There is some stuff in ps_app, but to which iteration of efficiency correction calculation does the current content correspond? Best wishes from Jens Ivar -- _____________________________________________________ ________| Jens Ivar Jřrdre |_______ \ | Dept. of Physics Office: 521 | / \ | Allégt 55 Phone: +47 55 58 27 92 | / \ | 5007 Bergen Fax: +47 55 58 94 40 | / / | Norway E-mail: jensivar.jordre@ift.uib.no | \ / |_____________________________________________________| \ /__________) (_________\ "To be or not to bop" (Dizzy Gillespie) _______________________________________________ Brahms-dev-l mailing list Brahms-dev-l@lists.bnl.gov http://lists.bnl.gov/mailman/listinfo/brahms-dev-l
