Hello members of this list,
I have been beating my head against the wall concerning memory leaks.
Here is what I have found so far.
1. The memory leak in which TObjArray's were being created happened in
DC Tracking (what a surprise!!!)
2. The TObjArray's were directly correlated to how many BrLocalTrack's
and how many BrVirtualTracks there were. The formula is at least for
one combination that I was doing was #TObjArrays = 2*#BrLocalTrack's +
#BrVirtualTracks + 45.
3. There is no memory leak concerning TObjArray's per se. It comes from
BrLocalTracks mostly.
4. The problems appear to be with the clones arrays in DC tracking. As
I look in detail, clones arrays become more and more mysterious, so I
studied the effect of using TObjArrays instead of the clones arrays.
The penalty is horrendous, so we need to figure out how to use the
clones arrays.
4. I went ahead and changed where we clear the clones arrays in DC
tracking. I don't do any at the beginning of the event. After the
event, I do a delete on all of the clones arrays. This seems to make
things cleaner, but probably slower, however not nearly as slow as using
TObjArray's in their place. I'm concerned about running for the moment.
That cleaned things up, but then I got strange errors when after running
for a while when it would try to shrink the size of the clones arrays.
If I would do a delete before the expand, I would get some error on
event #47 saying it could not find an object to remove. If I would not
do the delete, I would go until event #67 where I would get an error in
the Expand routine saying it was not able to truncate active objects. I
dug around in the code and I more or less understand what is going on
(although it is pretty complicated) and things look ok to me. So there
is still something going on behind the scenes that I don't understand
about the shrinking.
5. Since we were crashing in the Expand, I undefined the USESHRINK so
that we would not do the expand. I thought that perhaps I could get
away with that since the DCTracking is now much cleaner after finding
the other errors. The arrays do not get nearly as large as they used
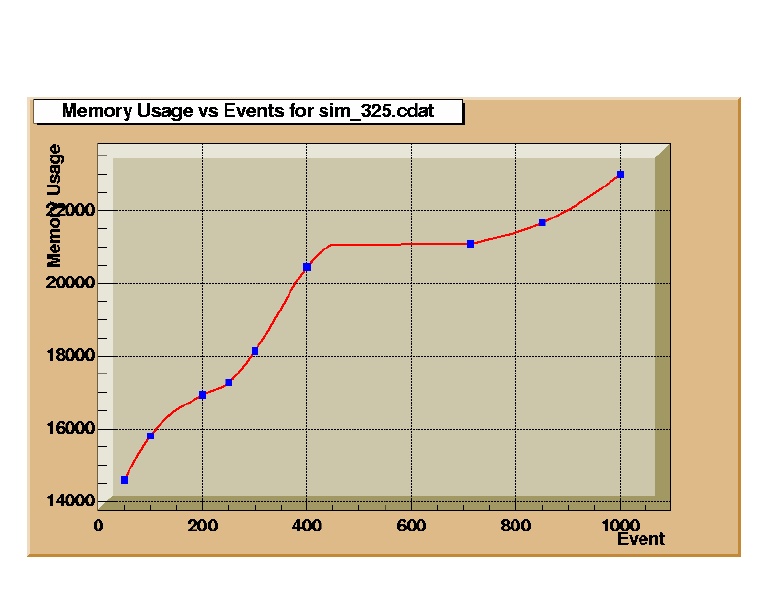
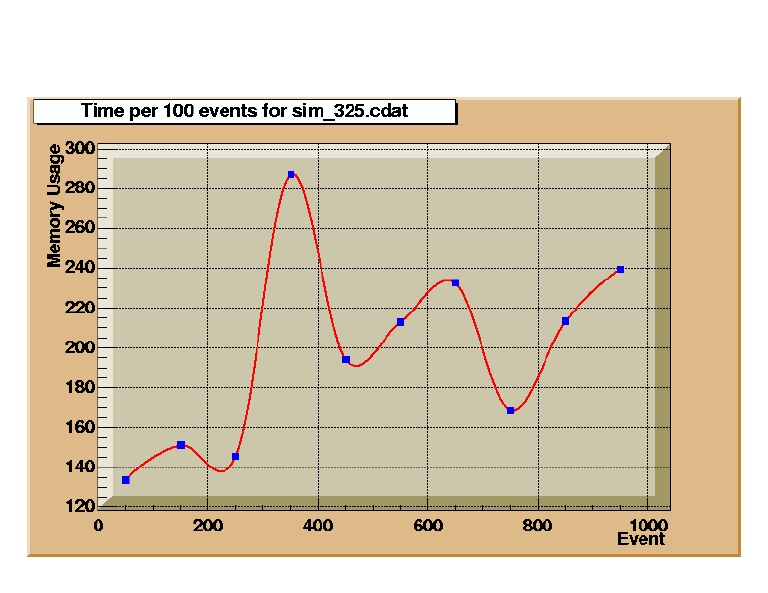
to. That let me run through all 1067 events in sim_325.cdat.
That gives the following results as far as time and memory usage is
concerned as shown in the attached JPG file. The time per 100 events is
shown in the second attachment.
The situation is not optimal, but I went ahead and checked in the
BrLocalTrackDC that made these, because it at least runs through
sim_325.cdat which is a file with fairly complicated tracks that really
exercises the DC Tracking. I would think that most others might be less
stringent.
Let me know any comments you might have.
Kris
This archive was generated by hypermail 2b29 : Tue Feb 01 2000 - 20:35:04 EST