Pad Monitor for BRAHMS

Contents:
This document is meant as a users guide to the Padmonitor program for the
BRAHMS TPC's. Details about the actual code can be found here.
The program was originally written by Joachim Schambach, (jschamba@physics.utexas.edu)
and was later modified by Lucas Pereira, (lucasp@sseos.lbl.gov) to be
used in STAR. Modifications and new features have been added for the
use of BRAHMS by Allan G. Hansen, (aghansen@nbi.dk).
Some of the features described here are only relevant to STAR, but
may be useful to BRAHMS later.
The executable is ./padm/bin/padm. It takes no
command-line arguments.
To run the pad monitor, you must set the environment variable
XENVIRONMENT. This variable should specify the name of the attribute
file. For example, to use the default (supplied) file, type:
- setenv XENVIRONMENT ./padm/wrk/PadMonitor.ad
Alternatively, the X-Windows software will look for a file called
PadMonitor in your home directory, if your XFILESEARCHPATH
environment variable is setup correctly.
The PadMonitor.ad file controls the colors of the padmonitor
histograms and points to a configuration file, which specifies the
layout of the padplane and details about the data. The default file in
PadMonitor.ad is
./padm/wrk/.ConfigurationFile. Should the program
not find the PadMonitor.ad file it will look for the configurationfile
.ConfigurationFile in the directory where the program is called from.
If no configuration file is found, the program will stop.
NOTE: Some entries concerning the padplane setup must be set in
the configuration file, otherwise the program will not work
properly. See more on this in the Configuration File section.
Since BRAHMS has different TPC's, different
configurationfiles will be needed. To make an easy userfriendly
environment a small setup program can be used together with the
padmonitor program. The setup program is
./padm/bin/select and can be used independently of the
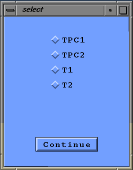
padmonitor. The program pops up a window as seen below, and a TPC
can then be selected with the mouse.

When Continue is pressed the select program generates a file
tpc.dat with the name of the chosen TPC and the program then
closes. The padmonitor now looks for a configuration file with the
name of the chosen TPC as an extension to the configuration file name.
If for example the name of the configuration file is specified as
.Configuration the padmonitor program now looks for a file
called .Configuration_TPC1, if TPC1 has been selected. The
select program can be used in combination with the padmonitor program
simply by running ./padm/bin/Padmonitor which is
just a small commandfile that first calls select and then padm. Using
the select program is optional, the padmonitor can be run without this
if prefered.
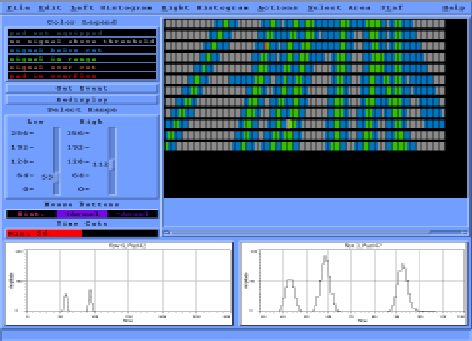
If everything is OK the main window will fill out the screen showing the
padplane, the histograms and the following menu:

The pad monitor is designed to have interchangeable I/O routines, while
the overall interface remains much the same. To read in data, you should
go to "File -> Open File" from the menu. A dialogue box will pop up,
and you select the name of the data file you wish to open.
An example datafile can be found in ./padm/doc/ with
the name tpc_out.dat (see more on this in the I/O Formats section).
After you select an input file, click on OK. Click on "Get Event"
(either from the "File" menu or from the button on the left side of
the window.) The pad monitor will read in an event of data and display it
on the screen.

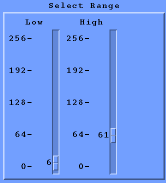
After you read in the data, you can set the upper and lower cutoffs
on pulsheights (ADC value) with the two sliders on the left side of
the window. Pads that are below the minimum cutoff appear light blue,
pads above the maximum cutoff appear rusty brown, and pads between the
two cutoffs are green.
The max/min cutoffs have several different modes. To change modes,
go to the "Edit" menu, and select one of the three modes:
- Maximum (default): The cutoffs are compared against the maximum
value of this pad. This is not applicable if the input
file does not have a Z-component (STAR).
- Minimum:The cutoffs are compared against the minimum value of
this pad. This is also not applicable if the input file does not
have a Z-component (STAR).
- Cap_Res:The cutoffs are compared against the single aggregate
number. This mode should be used if the input file does not
have a Z-component (STAR).

There are two histograms at the bottom of the screen. They both plot the
ADC value of a single pad vs. time bin.
The content of the Left Histogram is controled by the padplane.
With the left mouse button you can select from the padplane, which pad
to display on the histogram. When you click on a pad, an indicator
(bright red rectangle) will be drawn around the selected pad:

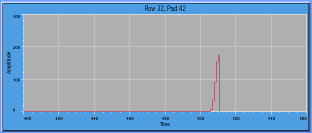
The pad row/number will appear over the histogram, and
it will plot value vs. time.
NOTE:
When there is no time bucket data for the selected pad,the histogram
will have nothing to draw.
- "Left Histogram -> Zoom" lets you magnify a region of interest by
clicking the left mouse button at one corner of the region of interest
in the histogram and then drawing a rectangle to the opposite corner
while keeping the button pressed. The histogram will be slightly
adjusted from what you choose to make it fit in the window.
- "Left Histogram -> Request Position" lets you click on one of the
histogram bins and displays the position in the bottom message
area. The numbers displayed represent the x position and the contents
of the bin.
- "Left Histogram -> Reset Default" reverses the effect of "Zoom",
i.e. displays the whole histogram again.
- "Left Histogram -> Low time cut" and "High time cut" let you choose the
left and right bounderies for calculating the Time cut value in order
to get rid of irregular bins, or simply to make "slices" in the TPC
y-plane. Just choose one of these two items and then click on the
desired bin in the histogram. The "Time Cuts" labels above the
histograms will display the chosen cut value. If no cuts are selected
the labels will be black, otherwise they will be red and green for low
and high limit cuts respectively.

- "Left Histogram -> Postscript Output" writes
a postscript representation of the histogram to a file. This, however,
requires that the path for the "afm" fonts is compiled into the
program. This path is probably different on sseos from my
machine. Therefore, this item might not work. If you want me to, I can
change this to work. -- jschamba
The Right Histogram is meant as a "backup" histogram which makes it
possible to compare histograms for different pads and/or different
events. The layout for the right histogram is exactly the same as for
the left.
- "Right Histogram -> Transfer left to right" transfers the left
histogram information into the right histogram. The right histogram
information will remain the same until a new transfer is done.
- "Right Histogram -> Zoom", "Request Position" and "Reset Default"
are similar to the left histogram functions. These buttons are "shaded
out" in the Right Histogram menu until a transfer from left to right
is performed.

The pad monitor allows the user to select (highlight) an area of the
TPC. This area can be any subset of the pads.
The middle and right mouse buttons are used to select an area. The
middle button is used to "positively select" area. This means that,
when you drag the middle mouse button, it will create a rectangle.
When you let go of the middle mouse button, every pad that touches
this rectangle will become selected. You can do this multiple times,
and the total selected area will be the union of all the rectangles.
The right mouse button is used to "negatively select" area. This means
that, when you drag the right mouse button, it will create a rectangle.
(This rectangle uses a dashed line, rather than a solid line, to
signify that it subtracts rather than adds to the selected area.)
When you let go of the right mouse button, every pad that touches
this rectangle will become deselected.
You can actually select two areas at the same time. These areas are
called "area 1" and "area 2". Area 1 is the default area -- when
you first start up the pad monitor, the middle and right mouse buttons
will affect area 1. If you wish to select area 2, go up to the
"Select Area -> Select Area 2" menu option. Now the mouse buttons will
affect area 2. Use "Select Area -> Select Area 1" to get back to working
with area 1.
To help remind you whether you're currently selecting area 1 or 2, there
are three boxes on the left side of the screen. These three boxes
represent the function of each of the three mouse buttons. When you
first start up the pad monitor, the three boxes will say "Hist.",
"+Area1", and "-Area1". The three buttons are also shaded with the
appropriate highlighting color. When you switch between selecting
area1 and area2, the text and color of these buttons will change.
Finally, there are a number of options under the "Select Area" menu:
- Select Area 1, Select Area 2
- Use these two buttons to switch between "select area 1" mode
and "select area 2" mode, as described above.
- Clear Area 1, Clear Area 2
- These two buttons clear (un-highlight) area 1 or area 2. This is
equivalent to using the right mouse button and drawing a box around
the entire sector.
- Write Selected Area 1, Write Selected Area 2
- These two buttons bring up a file-selection dialogue, and then
save the selected area to disk. The format of the file looks
like this:
- row 6 pads 42 to 98
- row 7 pads 41 to 55
- row 7 pads 82 to 98
- row 8 pads 43 to 52
- ...
- It lists contiguous segments in each row. There can be multiple
segments per row.
- Read Selected Area1, Read Selected Area2
- These two buttons also pop up a file-selection box. Then they
read the selected areas back in. They read files with the same
format as discussed above.
- Highlight Method 1, Highlight Method 2
- These two buttons control how the pad monitor draws the
highlighting for each pad. The users can then
customize the highlighting method to their own preference. The
choices are:
- Vertical Line (default)
Area1 draws a single vertical line on the left side of the
pad, and area2 draws a line on the right side.
- Single Block
Area1 draws a rectangle of the highlight color on the top
third of the pad, and area2 draws a rectangle on the bottom
third. (The middle third retains the pad's color).
- Double Block
Area1 draws rectangles on the top and bottom fifths of
the pad, and area2 draws rectangles on the 2nd and 4th
fifths.
- Horizontal Lines
Both draw horizontal lines on the pad, at intervals of
3 pixels. This method may take longer than other
methods, because it requires about 7 lines per pad.
- Solid
The pad is completely filled in with the highlighting
color. Note that if a pad is highlighted by area1 and
area2 at the same time, and area2 is drawing Solid, it
will not cover the leftmost pixel column of each pad.
This way, when the areas overlap you get a peek at the
area1 highlighting as well.
- None
No highlighting is drawn for this area. The area is
still in memory, and the mouse buttons still have an
effect. This is useful if you want an unobscured look
at the pads.
- Undo Last Move
Inspired by "Meta-x undo" in emacs, this function will undo the
previous select action. All of the following are considered
"actions" and can be undone:
- adding area with the middle button
- subtracting area with the right button
- clearing a selected area
- loading a selected area
The undo button actually remembers the three previous states, so
you can undo up to three actions. A fourth undo will bring it
back to the state it was in before you started undo-ing
(i.e. it "wraps around" after 3 undo's.)
In the "Actions" menu there are 3 items:
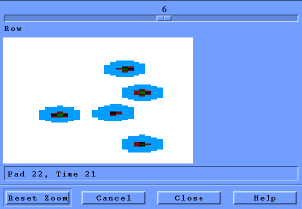
- "2D Display" pops up
a window with a 2-dimensional display of a row showing pad versus
time (x,y). The row number is changed with the slide in the upper part of
the window. It is possible to zoom in on an area selected by pressing
the left mousebutton and draging the mouse. Zooming is reset by
pressing the "Reset Zoom" button. The 2D Display window is closed by pressing
"Close". The "Help" and "Cancel" button are not used.

- "Save current as Pedestal" allows you to save the currently
displayed event as a pedestal for future pedestal subtraction.
- "Subtract Pedestal" turns pedestal subtraction on or off. This last
button is greyed out until you have saved an event as
pedestal. Pedestal subtraction is only done during "Get Event", and
can not be reversed for the event. You can only turn it off for the
next event.
There are two files that the pad monitor needs in order to be able
to run correctly. The first file is the Motif resource file. An
example of this file is given in
./padm/wrk/PadMonitor.ad. This file lists several
color choices that can be changed as the user prefers it. Most
importantly, though, it also lists the location of the configuration
file for the TPC.
An example of the configuration file is
./padm/wrk/.ConfigurationFile.
The configuration file may include the following fields,
each field is followed by an argument:
- Experiment brahms
-This tells the pad monitor which experiment related
I/O functions that should be used. Use "Experiment brahms"
for running in BRAHMS mode.
- SectorShape wedge
- This can be either "wedge" or "rectangle". BRAHMS TPC's are
all "rectangle".
- Bits 8
- This is the number of bits for each sample (ADC value).
The number of bits
affects the cut sliders and the number of bytes used for pad data.
Maximum number of bits is 16.
- NoOfSectors 1
- This is the number of sectors to handle (STAR). Currently the pad
monitor only handles 1 sector at a time.
- PadPitch 5
- This is the horizontal spacing of the pads, in pixels.
(In this example, there will be a pad every 5 pixels.)
- RowPitch 22
- This is the vertical spacing of the pad rows, in pixels.
- PadWidth 3
- This is the actual width of each pad. In this example, each
pad is 3 pixels wide, with (5-3=) 2 pixels between each pad.
- PadHeight 20
- This is the actual height of each pad. In this example, each
pad is 20 pixels high, with (22-20=) 2 pixels between each pad.
- Samples 512
- This is the number of time bins for each pad.
- XMin 0.0
- histogram limits. The histogram axis will
change according to the selected number.
- YMin 0.0
- YMax 256.0
- RowsPerSector 12
- This is the numbers of rows in this sector. Currently,
all row numbers (below) must be between 1 and this number.
- PadsPerRow 96
- This is the numbers of pads in each row. It should only be
specified when "SectorShape" is "rectangle".
- Row 32 Pads 98
- Row 31 Pads 100 ...
- This lists the number of pads for each row. The row is centered
so that rows line up correctly. Entries like these are only
necessary for "SectorShape wedge".
To make the program run properly the
following fields must be specified in the configuration file:
Experiment
Bits
RowsPerSector
PadsPerRow (or Row if "SectorShape wedge")
The other fields will be asigned a default value if they are not
specified. Following default values will be used:
SectorShape rectangle
NoOfSectors 1
PadPitch 4
RowPitch 31
PadWidth 3
PadHeight 20
Samples 256
XMin 0
YMin -256
YMax 256
The padmonitor so far only supports reading data from file
(BRAHMS). This file should have the following binary format:
	+----------------+		- start file
	| file ID        |	int
	+----------------+		- eventheader
	| event number   |	int
	| number of hits |	int
	+----------------+		- padheader
	| pad number     |	int
	| number of bins |	unsigned char
	| first bin      |	unsigned char
	+----------------+
	| bin 0 ADC      |	unsigned char
	| bin 1 ADC      |	 ...
	| 	...      |
	| bin n ADC	 |
	+----------------+		- next eventheader
	|       ...      |
        |                |
The first two bloks of an event (eventheader and
padheader), are defined as structures . The ADC values are here
shown as being of type char. If however the program is running with
"Bits" larger than 8, the type should be "short". Currently the program only
handles 1 byte ADC values, corresponding to "Bits 8". If two bytes
ADC values are used, some minor modifications must be made
in the function that reads in the events (see details here).
A Monte Carlo input file, specially for the padmonitor, can be created
from SONATA. When the SONATA package i compiled with the preprocessor
option -DPADM, a file called tpc_out.dat is created when events
are processed in SONATA. The file will contain the digitized TPC response
following the above data format.
Note: the tpc_out.dat file should be removed after each SONATA run,
otherwise the new events will be written in the existing file and mess
up the structure.
Here is an overview of some of the common problems that you may
encounter when running the pad monitor:
If you get the message:
- No Configuration File. Quitting ...
when you try to run the pad monitor, then the program is unable
to find the Configuration file. Check to make sure that:
- The XENVIRONMENT variable is set correctly. This environment
variable should point to the PadMonitor.ad resource file that
you want to use.
- The PadMonitor.ad resource file that you are using contains
the line:
"PadMonitor*configFile: .ConfigurationFile"
(Where .ConfigurationFile is the name of the configuration file
that you want to use.)
- The .ConfigurationFile exists, and is readable.
Latest update 24.07.97
Allan G. Hansen, aghansen@nbi.dk
