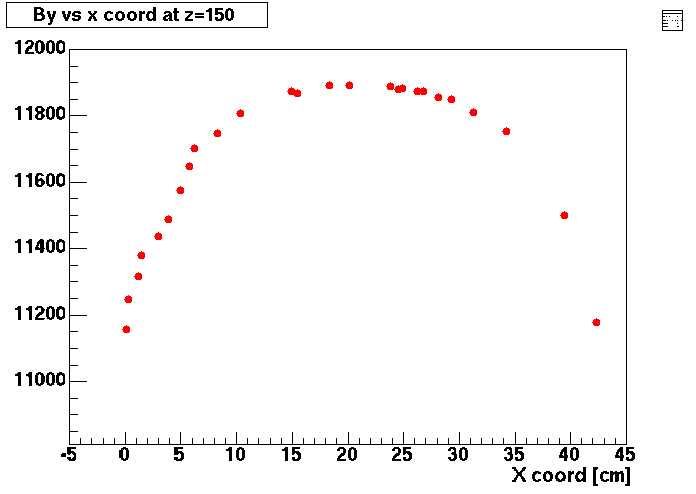
This is a continuation of the merging of all runs recorded during the mapping of D4. the following figure shows the By compononet as function of the x coordinate.

Each magnet was mapped twice; once at the highest field (as is the case of the previous figure), and then at half full field.
The figures shown below are the result of the D4 map at high field. These plots are the result of a first analysis pass.
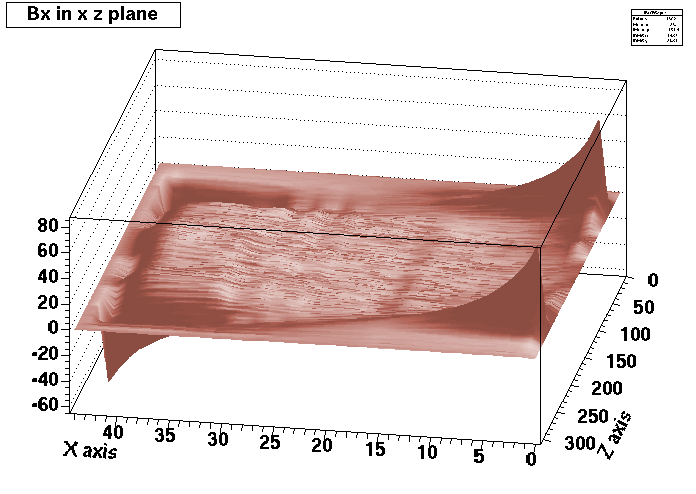
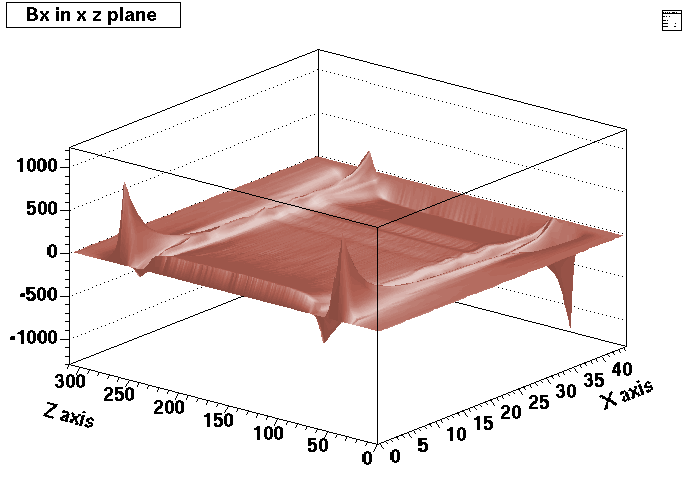
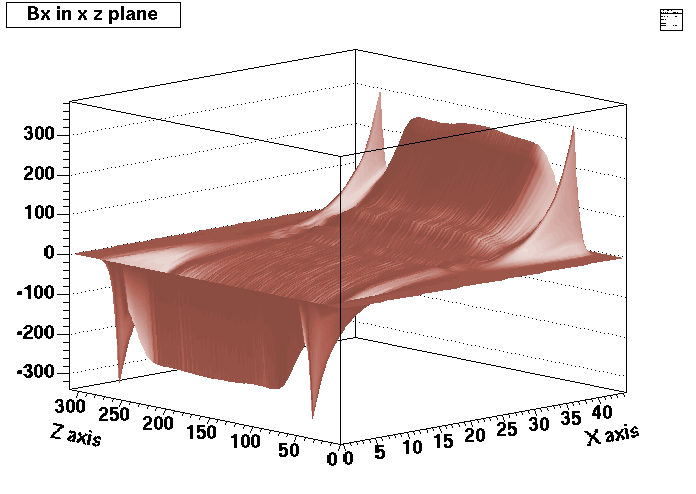
The small component plots (Bx and Bz) can be used as an indicator of the quality of the map. By symmetry, those components should be zero in the middle of the gap. Small misalignements or rotations during mapping will introduce strong "contamination from the big By component. Because pitch and roll are measured at each point of the map, corrections can be applied.
The following plot shows the value of By at the mid plane.
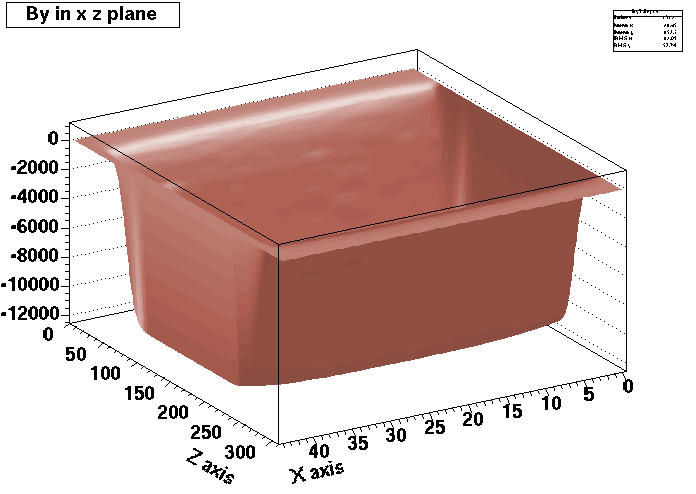
The axis of the scan are indicated in the figure, the units are cm. The vertical axis of the plot shows the value of the field at the plane y=0.
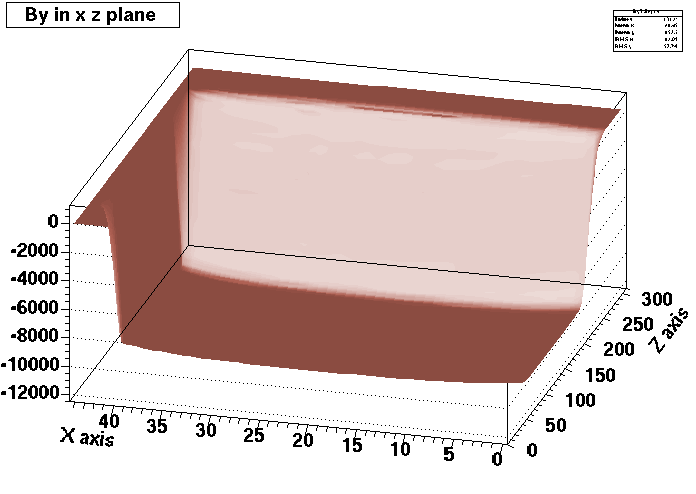
The same plot has been rotated to show that the field is not constant along the x coordinate of the gap.
All our dipoles have a quite constant field along the width of the gap. D4 is different because the height of the gap was increased and there is a brass bar between the
two coils of the magnet.
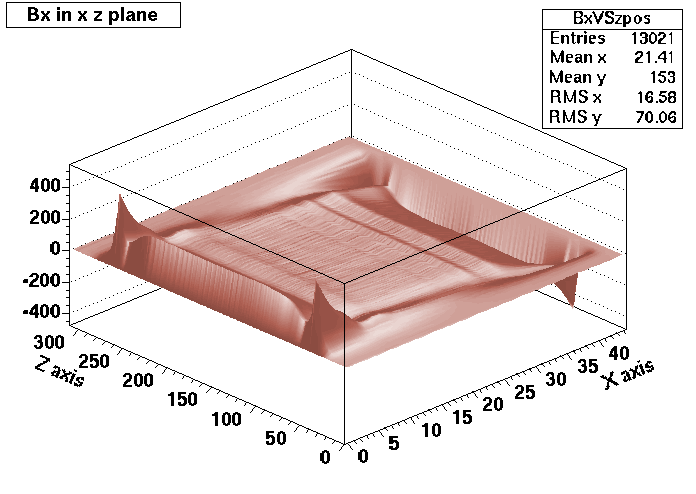
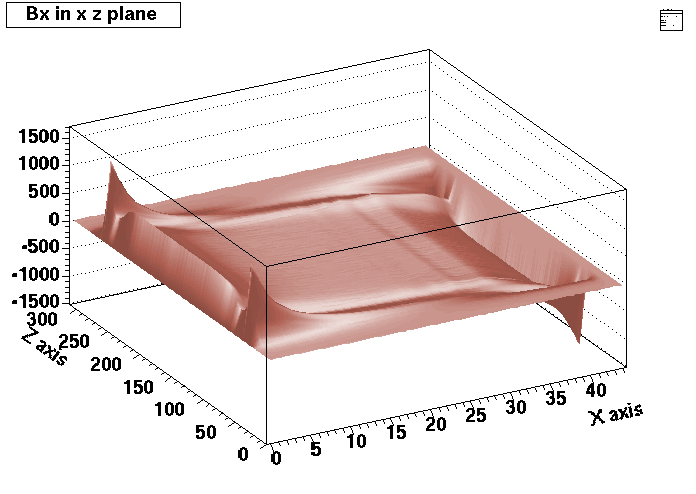
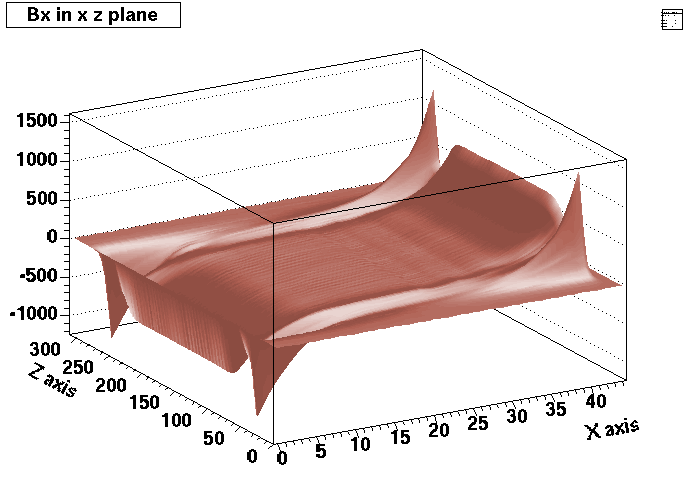
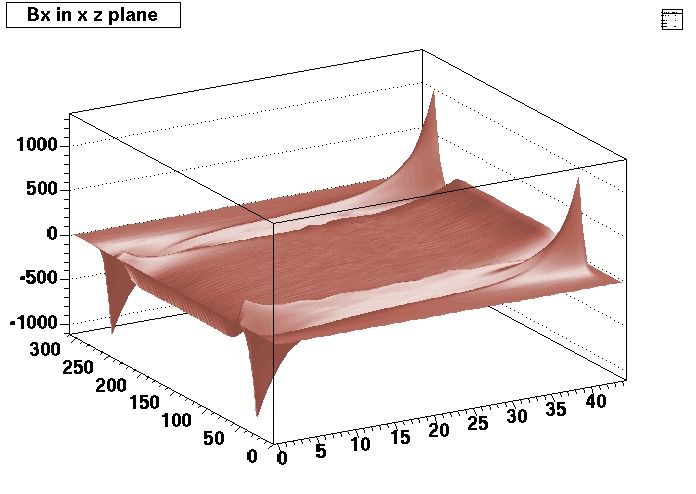
The following figure shows one of the small components Bx measured at the plane y=0.
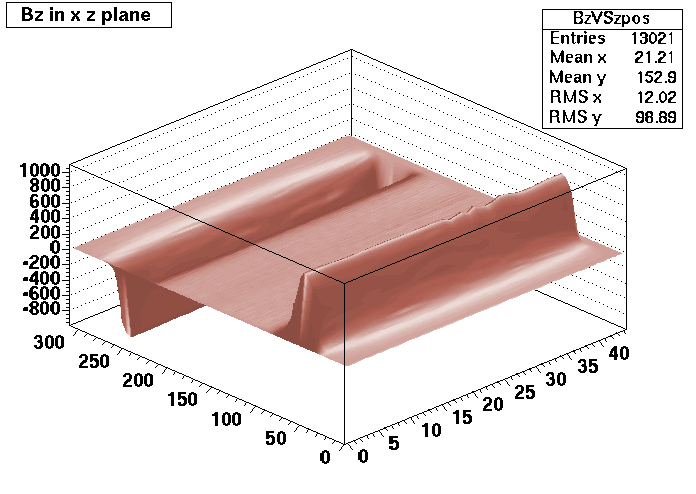
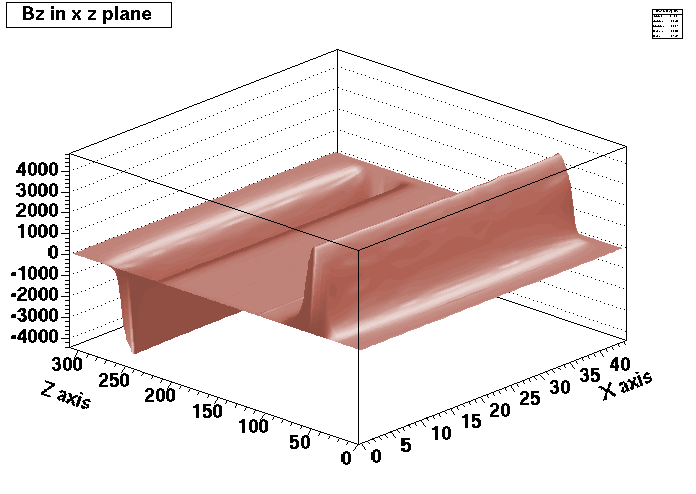
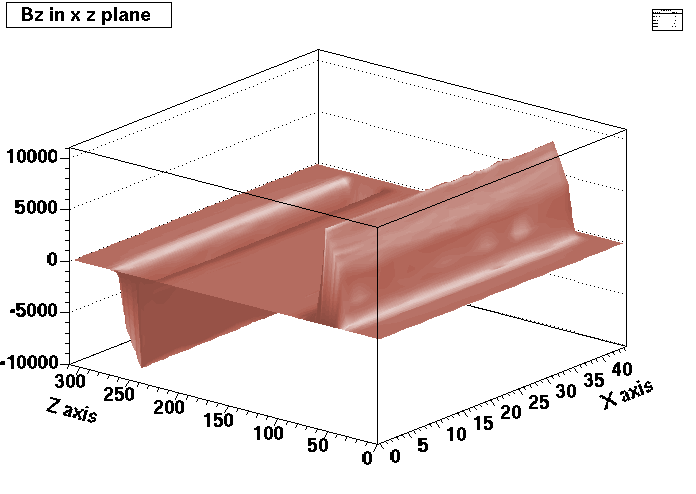
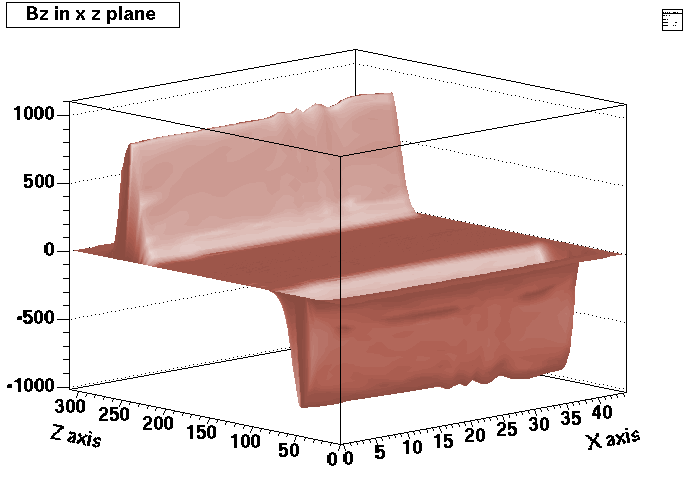
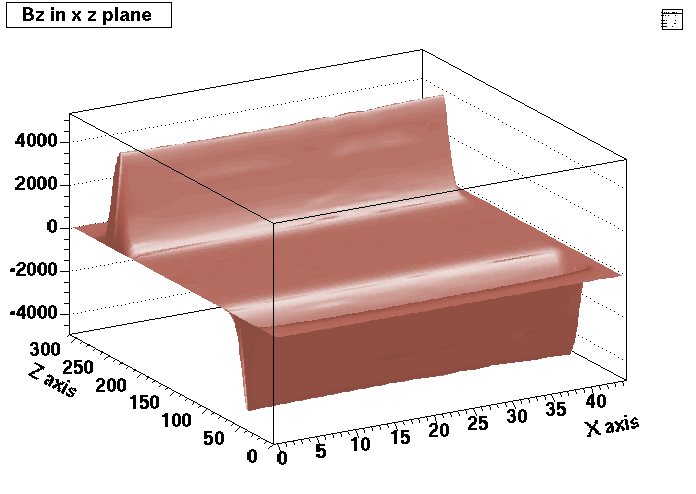
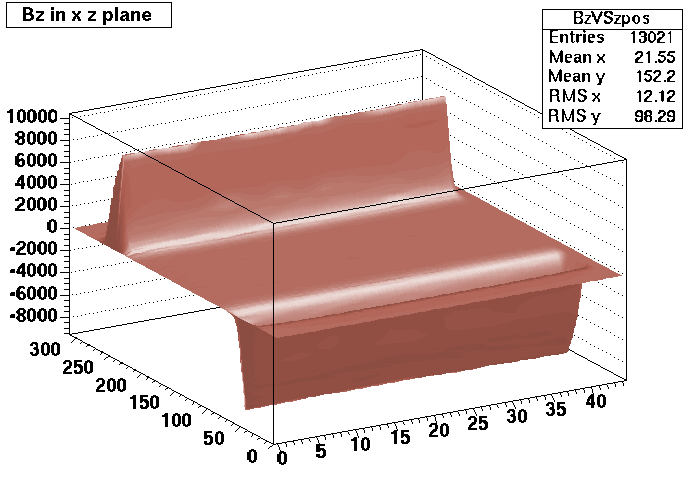
Finally, the Bz component at the mid plane is shown in the figure below.
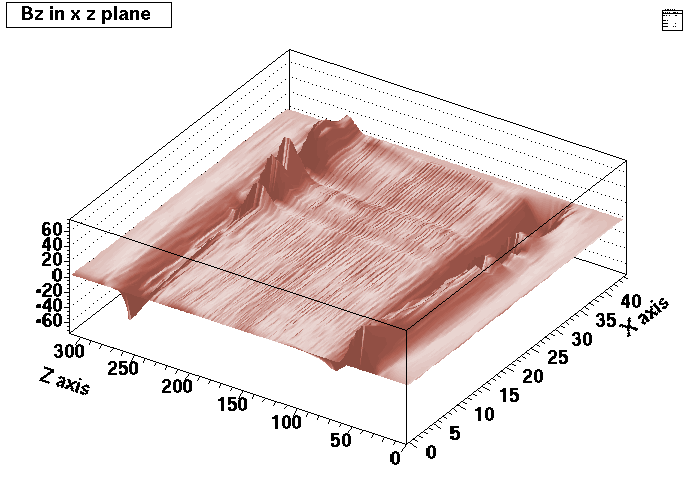
As of today (6-June-2003) I would like to improve the corrections to the small components, specially Bz. All the tools needed to do that work have now been translated into ROOT macros.
The remaining work consists of producing 1cmX1cm grids for each plane mapped, and then interpolate those values to produce a cubic 1cm grid for the complete map. Once that is done the coordinates will be translated to a frame that has the origin at the center of the gap and the map will be available.
After the D4 full field map is done I will proceed to produce the map at half field.
As the analysis proceeds, I'm adding figures showing the behavior of the small components in different planes.
The mapping of all BRAHMS magnets will be done with a single positioning jig that fits all magnets. This jig consists of a long rail (10 feet) along the z axis. A trolley moves along the rail driven by a threaded rod and a stepping motor. A three axes probe can be mounted on both sides of the trolley (put a figure). The rail sits on the magnet yokes to eliminate sagging. Both extremes of the rail sit in window frames attached to the field clamps. The x and y displacements are done manually. The window frames have holes drilled at 1/2 and 1/4 inch to move the rails along the x axis. The vertical displacements are done with four threaded rods. The vertical position is read on each corner from a scale fixed to the frame.
The following is the status of the project as of
11-SEP-1997
The following is the status of the project as of
8-OCT-1997
The following is the status of the project as of
7-NOV-1997
The program has been written in C to simplify the serial port communication and
to accomodate to the fact that most vendors provide their software in that
langague.
Basic functions for the system have already been programed, and data has been
written to a NFS mounted disk in the sgs0 machine.
Plans for the very near future:
The following is the status of the project as of
12-JAN-1998
The following is the status of the project as of
2-FEB-1998
Some effort was invested to make the system as compact as possible, the total
height of the trolley, the rail and the cable tray is only 3.5 inches.
The three axes probe is mounted on the far side of the trolley, in one of
the six mounting holes. On top of the trolley one can see the level sensors
(blue labels) that will measure the pitch and roll of the probe as it moves
along the rail. These sensors have a one miliradian resolution, and are being
read by the OMEGA 1050 data acquisition board linked to the computer via
the serial port COM1.
The following is the status of the project as of
9-APR-1998
The D5 magnet is being mapped at this moment. As of this date we have accumulated data consisting of measurements of the three components in a grid of 1 cm
steps in y and z and 1 inch along x axis (1/4 of an inch close to the coils).
The picture above shows our setup to map the magnet in one of the AGS power
supply maintenance area. The frame that supports the rail is clearly seen
mounted on the yellow field clamp. The stepping motor driver and the ADC board
with its power supply can be seen on the samll rack mounted on wheels. The table behind the rack has the computer monitor, the gaussmeter, and an X terminal
to look at the data just recorded.
In this picture the trolley that carries the probe and tilt sensors is seen
close to the gap of the magnet, the height of the gap is close to 4 inches.
On the side of the trolley one can see the probe holder with 6 holes
one centimeter appart. For this small gap magnet all y coordinates were obtained
by placing the probe in these 6 holes.
The horizontal bar on which the rail sits has two sets of holes 1/2 inch
appart. An offset of 1/4 of an inch between sets allows x displacements as
small as 1/4 of an inch. Once the rail is in position it is secured with
one of the brass screws.
One one side of the picture one can see the threaded rods used to move the
rail up and down. Scales were glued to the frame to read the y displacement.
The scales have 10 thousand of an inch graduations.
This plot shows the vertical component of the field in one of the z scans for
a plane located 1 cm below the mid plane. The x coordinate of the scan is
approximately 4 cm away from the coil. The current flowing through the coils is 800 amps.
The main purpose of this project is to test and debug the readout of the TPCs.
We are using the FEE and Readout boards designed and manufactured by the STAR
collaboration. We have received 20 FEE cards and one Readout board.
The following is the status of the project as of
11-SEP-1997
The manufacturing of the following pieces used to support the FEE has been
completed:
Plans for the very near future:
The following is the status of the project as of
11-SEP-1997
The following is the status of the project as of
16-SEP-1997
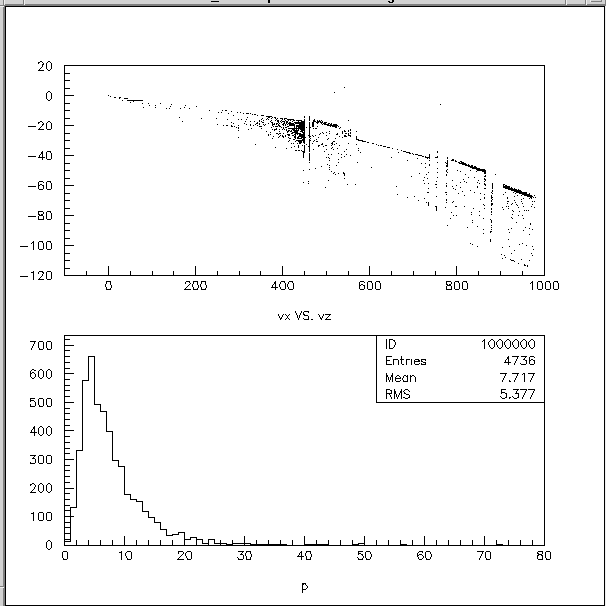
The upper pannel of the previous figure shows the location of the vertices of
secondary interactions. One can recognize the detector walls as well as the magnet yokes. The right most concentration of secondary vertices is one of the walls of the C1 detector (set at a thickness of 2 cm ). Just from this figure one can infer that background production on thick detector walls can be a problem
for this particular spectrometer setup.
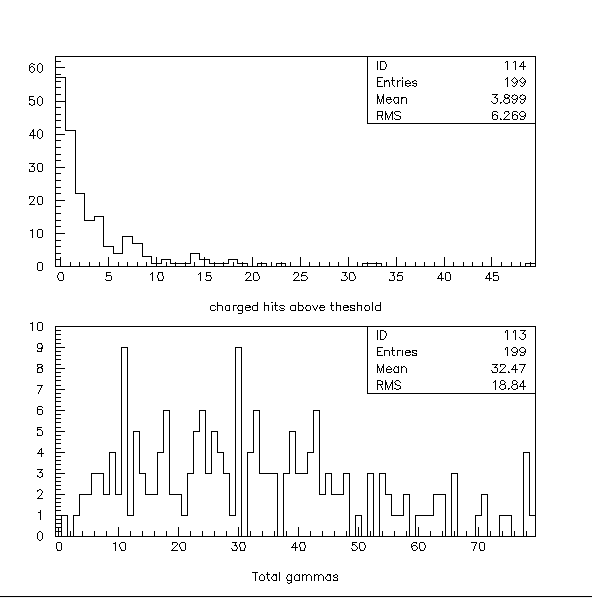
A more detailed look at this background can be obtained if one studies tracks
of secondary particles that originated in the wall of the detector closest
to the
collider and passed through the detector. The following histograms counts particles above threshold and the gammas.
The upper pannel of this figure indicates that in average there will be four
background particles per event.producing Cherenkov light. At this setting of
the spectrometer the number of primaries above threshold is 2.5
The lower pannel indicates that in average there will be some 30 gammas in
the active volume.
The previous setup of the spectrometer (high momentum particles) will most
likely not include the C1 detector and will identify the particles with the TOFs and the RICH. The low momentum runs will be done with the D2 magnet rotated by 5 degrees with respect to the D1 magnet in a way such that the C1 detector
will not "see" the primary vertex (obstructed by a block of shielding inside
the D1 aperture). The field in D1 is set at a higher value (6.5 kGauss) in order to sweep
charged particles into the aperture of D2.
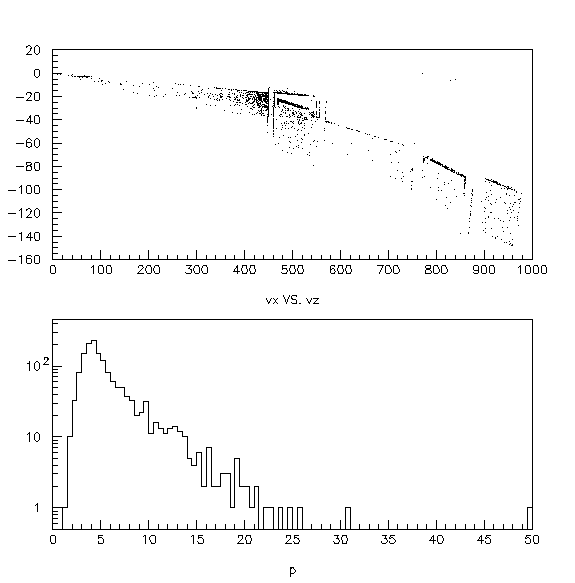
The following figure has been produced with the D2 magnet rotated 5 degrees
with respect to D1, and the values of the magnetic field are set to 6.5 kGauss
for D1 and 3.75 kGauss for D2. This setup will be used to measure the low
momentum particles at forward rapidities.
The upper pannel shows the vertices of all charged secondary particles, the lower pannel shows the momentum distribution of the charged primaries that enter the C1 detector.
The following table summarizes a background study done with this setup of
the D1 and D2 magnets.
The first column has the thickness of the detector
walls in cm. The Primaries column has the average number of charged particles
that enter the detector and were produced at the primary vertex (vz=0).
The third column called secondaries has the average number of charged particles that reach the detector but were produced in vertices with z coordinate other
than 0.
The "All charged" column has the average number of charged particles that enter
the C1 detector with no conditions on where they were produced. The "Chrgd abv thrs" column has the average number of particles that will produce light in the detector with no condition on their production vertex. And finally the column
marked "Sec abv thrs" has the average number of particles that will produce light but were produced in a secondary vertex (vz different from 0).
![]() The window frames that hold the rail will be the same used for the mapping of
the two E866 magnets.
The window frames that hold the rail will be the same used for the mapping of
the two E866 magnets.
![]() The probe holder has been designed and submitted to the shops. It will be mounted on the trolley designed and used for the E866 mapping.
The probe holder has been designed and submitted to the shops. It will be mounted on the trolley designed and used for the E866 mapping.
![]() The rail design is based on that of the E866 magnets but is now 10 feet long.
This trolley and probe holder job has been submitted to the Physics shop.
The estimated time
to complete this job is 42 hours.
The rail design is based on that of the E866 magnets but is now 10 feet long.
This trolley and probe holder job has been submitted to the Physics shop.
The estimated time
to complete this job is 42 hours.
![]() A purchase order for a three axes probe and three 25ft extension cables
from F.W. Bell has being placed. The
probe manufacturer indicated 12-SEP-97 as delivery date.
A purchase order for a three axes probe and three 25ft extension cables
from F.W. Bell has being placed. The
probe manufacturer indicated 12-SEP-97 as delivery date.
![]() F.W. Bell has delivered the three axis probe. The probe has been connected to
the gaussmeter and tested. We also mounted the probe in the mapping trolley
and found that it fits well. It took 52 hours to manufacture the trolley, spacers, a fixture to secure the long rail and small rings to align and secure the
probe.
F.W. Bell has delivered the three axis probe. The probe has been connected to
the gaussmeter and tested. We also mounted the probe in the mapping trolley
and found that it fits well. It took 52 hours to manufacture the trolley, spacers, a fixture to secure the long rail and small rings to align and secure the
probe.
![]() A Gateway 2000 PC has been allocated to the mapping project. We are implementing some Assembly language routines to communicate with the gaussmeter via a
RS-232 serial port.
A Gateway 2000 PC has been allocated to the mapping project. We are implementing some Assembly language routines to communicate with the gaussmeter via a
RS-232 serial port.
![]() The program fldmap has been written to control the positioning system as
well as reading the three components of the field. The trolley that carries
the probe has pitch and roll sensors that will be read at every point in the grid. I also plan to include encoders to record displacements along x and possibly along z. The main purpose of these encoders is to have the computer checking
for operator errors during x and z displacements of the system.
The program fldmap has been written to control the positioning system as
well as reading the three components of the field. The trolley that carries
the probe has pitch and roll sensors that will be read at every point in the grid. I also plan to include encoders to record displacements along x and possibly along z. The main purpose of these encoders is to have the computer checking
for operator errors during x and z displacements of the system.
![]() The long rail (10') has been designed and submitted to central shops. Their
estimate is 56 hours of labor and $500 of material.
The estimated delivery time is the end of November.
The long rail (10') has been designed and submitted to central shops. Their
estimate is 56 hours of labor and $500 of material.
The estimated delivery time is the end of November.
![]() We need a way to feed the Hall probe cables as well as tilt sensor cables.
This is something we want to work on to free the operator from having to
monitor constantly how the cable is dragged by the trolley that moves the
probes.
We need a way to feed the Hall probe cables as well as tilt sensor cables.
This is something we want to work on to free the operator from having to
monitor constantly how the cable is dragged by the trolley that moves the
probes.
![]() The program that will be used to map the dipole magnets has now the ability
to read the outputs of the pitch and roll level sensors that are placed on
the trolley. The readout of these voltages is done with a data acquisition
board that communicates with the PC via serial port 1. We had to wait almost
a full month for the delivery of the C language libraries to communicate to
this board, but are now ready to proceed with the mapping.
The program that will be used to map the dipole magnets has now the ability
to read the outputs of the pitch and roll level sensors that are placed on
the trolley. The readout of these voltages is done with a data acquisition
board that communicates with the PC via serial port 1. We had to wait almost
a full month for the delivery of the C language libraries to communicate to
this board, but are now ready to proceed with the mapping.
![]() During test in the lab. we found that the threaded rod that drives the trolley
enters in resonant modes when the trolley is close to both ends of the rail.
To solve the problem the rod is held in place with a set of six spacers, and
the resonances are basically absent all along the length of the rail.
During test in the lab. we found that the threaded rod that drives the trolley
enters in resonant modes when the trolley is close to both ends of the rail.
To solve the problem the rod is held in place with a set of six spacers, and
the resonances are basically absent all along the length of the rail.
![]() A tray for the gaussmeter cable was added to one side of the rail. For the
longest magnet it will be necessary to have an operator making sure that the cable
connectors do not get entangled. More solutions can be found during the mapping.
A tray for the gaussmeter cable was added to one side of the rail. For the
longest magnet it will be necessary to have an operator making sure that the cable
connectors do not get entangled. More solutions can be found during the mapping.
![]() The following is a picture of the trolley that carries the gaussmeter probe
and tilt sensors.
The following is a picture of the trolley that carries the gaussmeter probe
and tilt sensors.


Status of the MTPC1 cosmic ray test
![]() RF shield made of a 1/16 inch copper with cutouts for the FEE cards.
RF shield made of a 1/16 inch copper with cutouts for the FEE cards.
![]() Half an inch thick plate made of aluminum to hold the FEE cards that also
serves as heat sink.
Half an inch thick plate made of aluminum to hold the FEE cards that also
serves as heat sink.
![]() A third aluminum frame to hold the Readout Boards that will also serve as
heat sink.
A third aluminum frame to hold the Readout Boards that will also serve as
heat sink.
![]() A cosmic ray trigger has been setup in the Yellow Lab. (2-224) and we are waiting
the completion of the receiver board to start the tests.
A cosmic ray trigger has been setup in the Yellow Lab. (2-224) and we are waiting
the completion of the receiver board to start the tests.
Status of the C1 detector
![]() The BRAHMS GEANT has been setup to study the background production on the walls
of the detector.
The BRAHMS GEANT has been setup to study the background production on the walls
of the detector.
![]() The latest version (Ver 1.3) of the Brahms GEANT has been run in two configurations: A high momentum setup with the D2 magnet rotated by 1.9 degrees with respect to D1 and a Low momentum setup with D2 at 5 degrees. The field in both magnets was set to 1/4 of the maximum values.
The following figure shows the location of the secondary vertices for the High momentum setup in the upper panel, and the momentum distribution for tracks
that originate in the interaction vertex.
The latest version (Ver 1.3) of the Brahms GEANT has been run in two configurations: A high momentum setup with the D2 magnet rotated by 1.9 degrees with respect to D1 and a Low momentum setup with D2 at 5 degrees. The field in both magnets was set to 1/4 of the maximum values.
The following figure shows the location of the secondary vertices for the High momentum setup in the upper panel, and the momentum distribution for tracks
that originate in the interaction vertex.
| Thickness | Primaries | secondaries | All charged | Chrgd abv. thr. | Sec. abv. thr. |
| 0.1 cm | 1.5 | 1.1 | 2.6 | 1.5 | 0.3 |
| 1.0 | 1.4 | 1.4 | 2.8 | 1.6 | 0.5 |
| 2.0 | 1.4 | 2.4 | 3.8 | 2.2 | 1.0 |
I remain convinced that the best way to fill this counter as well as the RICH is by first evacuating and then filling with pure C4F10. And that the safest scheme for evacuating these detectors is to put then inside a bigger tank. to eliminate pressure differentials.
Please send comments to: R. Debbe,
The following is the status of the project as of 8-OCT-1997
![]() A designer of the Physics Design Group has started to work on the layout
of the C1 detector. The inside dimensions of the of the detector are the following:
A designer of the Physics Design Group has started to work on the layout
of the C1 detector. The inside dimensions of the of the detector are the following:
The following is the status of the project as of 7-NOV-1997
![]() The conceptual design of C1 is done. The designer estimates two more weeks
to produce drawing that can be submitted to the shops.
The conceptual design of C1 is done. The designer estimates two more weeks
to produce drawing that can be submitted to the shops.
The dimensions of the active volume are now:
The thickness of the walls is 3/8" (~1cm), and entrance and exit walls can be as thin as 1 mill Mylar.
The following is the status of the project as of 12-JAN-1998
![]() The designer has produced detailed drawings for the detector as well as its
mirrors. These drawings have to be checked by engineers before they can be
submitted to the shops. It is estimated that the checking will be done at the
end of January.
The designer has produced detailed drawings for the detector as well as its
mirrors. These drawings have to be checked by engineers before they can be
submitted to the shops. It is estimated that the checking will be done at the
end of January.
![]() Additional photomultipliers have been purchased and will be delivered next
month (4-FEB-98). We will then have 37 of these PMTs. We have also purchased some
valves and tubing of the QF40 standard for the handling of the gas radiator.
We have also inquired about costs of the mirrors, and have received one
quotation for an amount close to what was budgeted.
Additional photomultipliers have been purchased and will be delivered next
month (4-FEB-98). We will then have 37 of these PMTs. We have also purchased some
valves and tubing of the QF40 standard for the handling of the gas radiator.
We have also inquired about costs of the mirrors, and have received one
quotation for an amount close to what was budgeted.
The following is the status of the project as of 10-APR-1998
![]() The designer drawings came back from the checker and are being modified. It
is estimated that the designer will need one more week to make these
corrections. This project can then be submitted to the shops for manufacturing.
The designer drawings came back from the checker and are being modified. It
is estimated that the designer will need one more week to make these
corrections. This project can then be submitted to the shops for manufacturing.
![]() A tank that can be evacuated and has enough volume to accomodate both C1 and
the RICH has been found and put in safe storage at the AGS.
A tank that can be evacuated and has enough volume to accomodate both C1 and
the RICH has been found and put in safe storage at the AGS.
The following is the status of the project as of 11-SEP-1997
![]() The signal from the Hamamatsu PMT R5900-03 M4F will be amplified before
digitization, to accomplice this task we are looking at the use of the
preamplifiers IO-354-1 or LeCroy MQS104A or TRA1000. We have already worked
with the first preamp but we plan to design a small circuit board with special
care to eliminate high frequency feedbacks. Similar work has to be done for
the LeCroy chips.
The signal from the Hamamatsu PMT R5900-03 M4F will be amplified before
digitization, to accomplice this task we are looking at the use of the
preamplifiers IO-354-1 or LeCroy MQS104A or TRA1000. We have already worked
with the first preamp but we plan to design a small circuit board with special
care to eliminate high frequency feedbacks. Similar work has to be done for
the LeCroy chips.
The following is the status of the project as of 12-JAN-1998
![]() Small circuit boards were designed to study the use of fast charge sensitive
amplifiers IO-354-1. We tried to make the boards with similar dimensions as
the R5900 PMTs,
plus eight right angle Lemo connectors for input and output connection, and
the DC power connections for the pre-amp with some noise filtering. The two
scope pictures shown below, show first the signal directly out of the PMT
and into 50 ohms scope input. This signal is extremely fast and clean, but
too small to register on an ADC, specially after several hundred feet of cable.
Small circuit boards were designed to study the use of fast charge sensitive
amplifiers IO-354-1. We tried to make the boards with similar dimensions as
the R5900 PMTs,
plus eight right angle Lemo connectors for input and output connection, and
the DC power connections for the pre-amp with some noise filtering. The two
scope pictures shown below, show first the signal directly out of the PMT
and into 50 ohms scope input. This signal is extremely fast and clean, but
too small to register on an ADC, specially after several hundred feet of cable.

The second picture was taken at the output of the IO-354 amplifier with a 50 ohms termination on the scope. On this picture one can appreciate how quiet is this setup as well as the fact that the signal out of the PMT is basically an impulse input for the amplifiers and it responds with its quoted 2 ns raise time and 40 ns decay.
Because the amplifier was designed in such a way that it has 50 ohms output impedance, the circuit cannot drive a cable of the same impedance when the pulse heights exceed some 140 mV. This pulse height corresponds to 4 photoelectrons. Eventhough the chance that one pixel will get more than two photons is low, we are investigating ways to bias the amplifier to raise that saturation limit.
![]() A good part of the amplification relies on the integration of the
charge in an ADC, we have to make sure that the system is linear and has a long
term stability. This work is being done at this moment in the lab.
A good part of the amplification relies on the integration of the
charge in an ADC, we have to make sure that the system is linear and has a long
term stability. This work is being done at this moment in the lab.
The following is the status of the project as of 2-FEB-1998
The output stage of the IO354 has a limit in current at 3mA, more current can be applied (200 mA acording to the designer at the Instrumentation Division) by raising the bias voltage or by reducing the resistor connecting the output to the negative power supply. The following plot shows how the saturation can be pushed to higher pulse heights by lowering the negative bias voltage from -12 to -15 Volts.

The measurement in this plot was done with a pulser and a 10pF capacitor at the input of the preamp. The output was read directly with the scope. The crosses are the output values obtained with the preamp. biased as indicated by the designers; the output connected to -12 Volts through a 2700 ohms resistor. For our application the pulse height of 1 photoelectron sits around 30 mV (in the vertical axis). The response of this preamp biased as specified is clearly not linear for more than 4 photoelectrons. Eventhough the probability to have more than two p.e. in one pixel of the photon detector is low. We want to set a margin of safety, and extend the region with linear response.
The full curve is the response of the preamp to the same input pulses, but this time the last stage transistor has 4 mA of current. The increase of current is obtained by lowering the bias voltage to -15 Volts. (An intermediate resistor sets the voltage to -12 V for the rest of the circuit. After this modification one can see that the linear region extends up to 6 photoelectrons.
![]() In order to achieve the high index of refraction in RICH, we will have to
make mixtures of C4F10 and C5F12. We have to be able to measure the index of
refraction of our mixtures.
I have put together an interferometer based on Youngs beam splitting. The
beam from a He Ne laser (mostly at 632.8 nm) is widened by a 1 inch focal
length lens and split with two pin holes made on a copper foil. The two
beams are then brought to one spot by a second lens. At this point the two
beams interfere. The interference pattern is then seen with a third lens that
puts a magnified pattern on a photodiode.
In order to achieve the high index of refraction in RICH, we will have to
make mixtures of C4F10 and C5F12. We have to be able to measure the index of
refraction of our mixtures.
I have put together an interferometer based on Youngs beam splitting. The
beam from a He Ne laser (mostly at 632.8 nm) is widened by a 1 inch focal
length lens and split with two pin holes made on a copper foil. The two
beams are then brought to one spot by a second lens. At this point the two
beams interfere. The interference pattern is then seen with a third lens that
puts a magnified pattern on a photodiode.
Between the second lens and its focus, the optical path (index*length) can be modified inside two parallel tubes machined to the same length by filling them with different gases or by changing their pressures.
The picture below shows the optics mounted on a steel plate. On the bottom picture one gets a better view of the aluminum piece where the two tubes were drilled. The red Polyflow line connected to one of the tubes is plugged to a diaphragm pump through a buffer volume to eliminate vibrations and turbulence.

The output voltage of the photodiode was read with the same program that we plan to use for the magnet mapping. First the pressure on one of the tubes is lowered to the limit of the pump: 22 inches of water (270 mbar) while the second tube remains in contact with the air of the lab. The pressure is then raised slowly and the computer records the voltage out of the diode.
The following is the record of one cycle; from 270 to 1021 mbar at 23 degrees centigrade. (Please disregard the title pitch VS z it belongs to the mapping project)

And the next picture is meant to show the good resolution of the system with a blow up the previous one.
