Beam-Beam Commissioning
- Both arrays are in place on the floor and fully operational.
- All tubes were tested for the light leak before and after the August/99 Run;
- Tubes' performance was analyzed, based on the pictures from the Blue and Yellow Runs:
All tubes had been checked again with the source and signal was traced to the Counting House. As a result of that:
- Four defected connectors on Right Array Modules were changed.
- Right Module 11 failed and was replaced by one of the spare tubes.
- High Voltage control was completely changed by adding another Power Supply Module specifically for the Big Tubes in both arrays. So, we'll have 3 separate modules: M3 for the Big Tubes; M2 for the Small Tubes in the LA and M1 for the Small Tubes in the RA. HV limit then will be restricted by the knob set on each mainframe (1700V for the Small and 2800V for the Big Tubes).
- "Monitor" code was slightly modified from the existed BrMonitorBB class and ready for the on-line monitoring of the collisions.
- "Dry Run" of Feb.2000 demonstrated full readiness of the Beam Beam Counters for the data taking. See full report below.
- Here we have main results of the August Run:
- Results of the Aug/99 Run:
Using Summary of the data for the August Run, we picked best runs to analyze data for the Left and Right
Arrays. Run 000217 for the Blue Ring (beam in the direction of the RA)
and Run000231 for the Yellow Ring (beam in the direction of the LA).
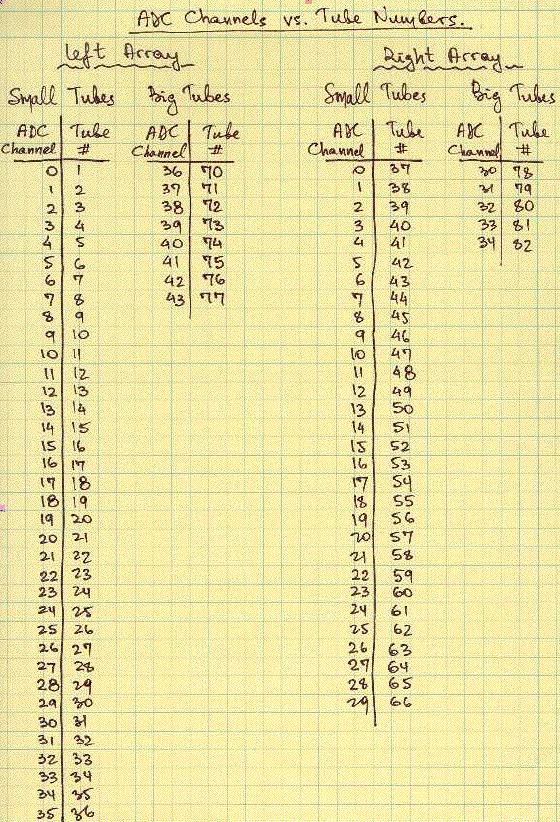
Relation between ADC Channel Number and Tube Number can be found here.
TDC channels were numbered identically.
BLUE Beam:
Here are we have the most interesting pictures of Run 217:
- RAdc (Full picture of the Right Array Adc)
Main conclusion we make out of the picture above, is that some particular area of the Right Array was hit. Mainly area located around upper-left corner of the Array: Right Modules ## 0-3, 5, 6, 9, 33, etc. This only proves, that beam was not properly centered and all detected particles mainly have come from the beam scraping the beam-pipe somewhere far behind the Left Array. It was confirmed by the Tiles results as well.
- Seq.014; Right Module #0: ADC Fitted with 4 Gausses
From the picture above one can try and argue the conclusion, that this particular tube was hit may be 2 or 3 times, since peaks are more or less equidistant. Also this picture shows, that we can potentially detected about 8 - 9 particles with any particular module, which basically agrees with GEANT simulations.
- Seq.014; Right Module #33 (Big Tube) TDC
TDC analysis tells us that first double peak is from the runs with only Beam-Beam trigger in, when the second peak is from the runs with both Beam-Beam and Tiles triggers together. Nature of the first peak splitting still remains unknown! :-(( . See more detailed analysis of different triggers below.
YELLOW Beam:
- LAdc (Full picture of the Left Array Adc)
From this picture one can conclude again, that Yellow Beam was also not properly centered and all detected particles were originated by the beam scraping the beam-pipe. In this case Left Modules ## 0, 1, 9, 10 etc. were hit more than the other ones. These modules are located in the right part of the Left Array.
Based on this analysis we can argue, that our ADC spectra can also be used as a rough probe for the centering of the beam.
Looking at the ADC spectra for different triggers one can see, that events which was triggered by Beam-Beam and Tiles trigger together have around 20% less intensity, than in case of a pure Beam-Beam trigger. Analysis of a trigger log book and real pulse pictures suggests that BB and Tiles trigger came earlier by about 25-40 nsec for the gate width of 70nsec. So, we made so simulations to see if this could be responsible for the 20% intensity drop. Here we have a pictures of some simplest simulations of this situation.
Counting Rates: Another interesting question would be, how do we have to set our trigger, so we don't start counting from the Beam-Gas collisions (accidental coincidences). In other words, coincidence of how many hits in both arrays do we have to consider to be sufficient for our trigger? Here you can find some simplest calculations and analysis of GEANT simulations, regarding this question.
Some calibrations were made for the Adc spectra:
   - only events with Beam-Beam Trigger were selected;
   - pedestal was subtracted;
   - Adc values were divided by the Gain value from the Lab studies for
     every particular tube.
Another calibration were made with the Gain values from the Hamamatsu catalog. Only Lab Gain calibration gave us some reasonable results, such as, same energy values of the peaks for the neighboring tubes. Here are some results of the calibration with the Lab measured Gain values:
BLUE Beam:
- RAdc One can still see, that beam was not properly centered, but more interesting thing is, that we can claim now, that some of the tubes experienced 2 or 3 hits. It can be seen in details on the pictures below:
- RAdc from 0 to 4 This picture shows identifiable peak in every tube and after the calibration, these peaks are in the same values of energy for every tube!
Next picture shows same effect in the Big Tubes: RAdc from 31 to 34
YELLOW Beam:
- LAdc Same as above, here you can see calibrated Left Adc pictures for the Yellow Beam.
- LAdc Ring 1 , LAdc Ring 2 , LAdc Big Tubes (Last Ring) Here you can see different amount of hits with respect of the different tube location. In the outer ring of the Big Tubes second peak is almost invisible.
All of the above proves, that our method of calibration is acceptable. Using it we hope to have some rough estimations of the Multiplicities on very early stages of analysis.
 to the Beam-Beam Counters Page
 Prof. Burton Budick, Yury
Blyakhman.
Last modified: Wed Apr 25 17:46:17 EDT 2001
Prof. Burton Budick, Yury
Blyakhman.
Last modified: Wed Apr 25 17:46:17 EDT 2001